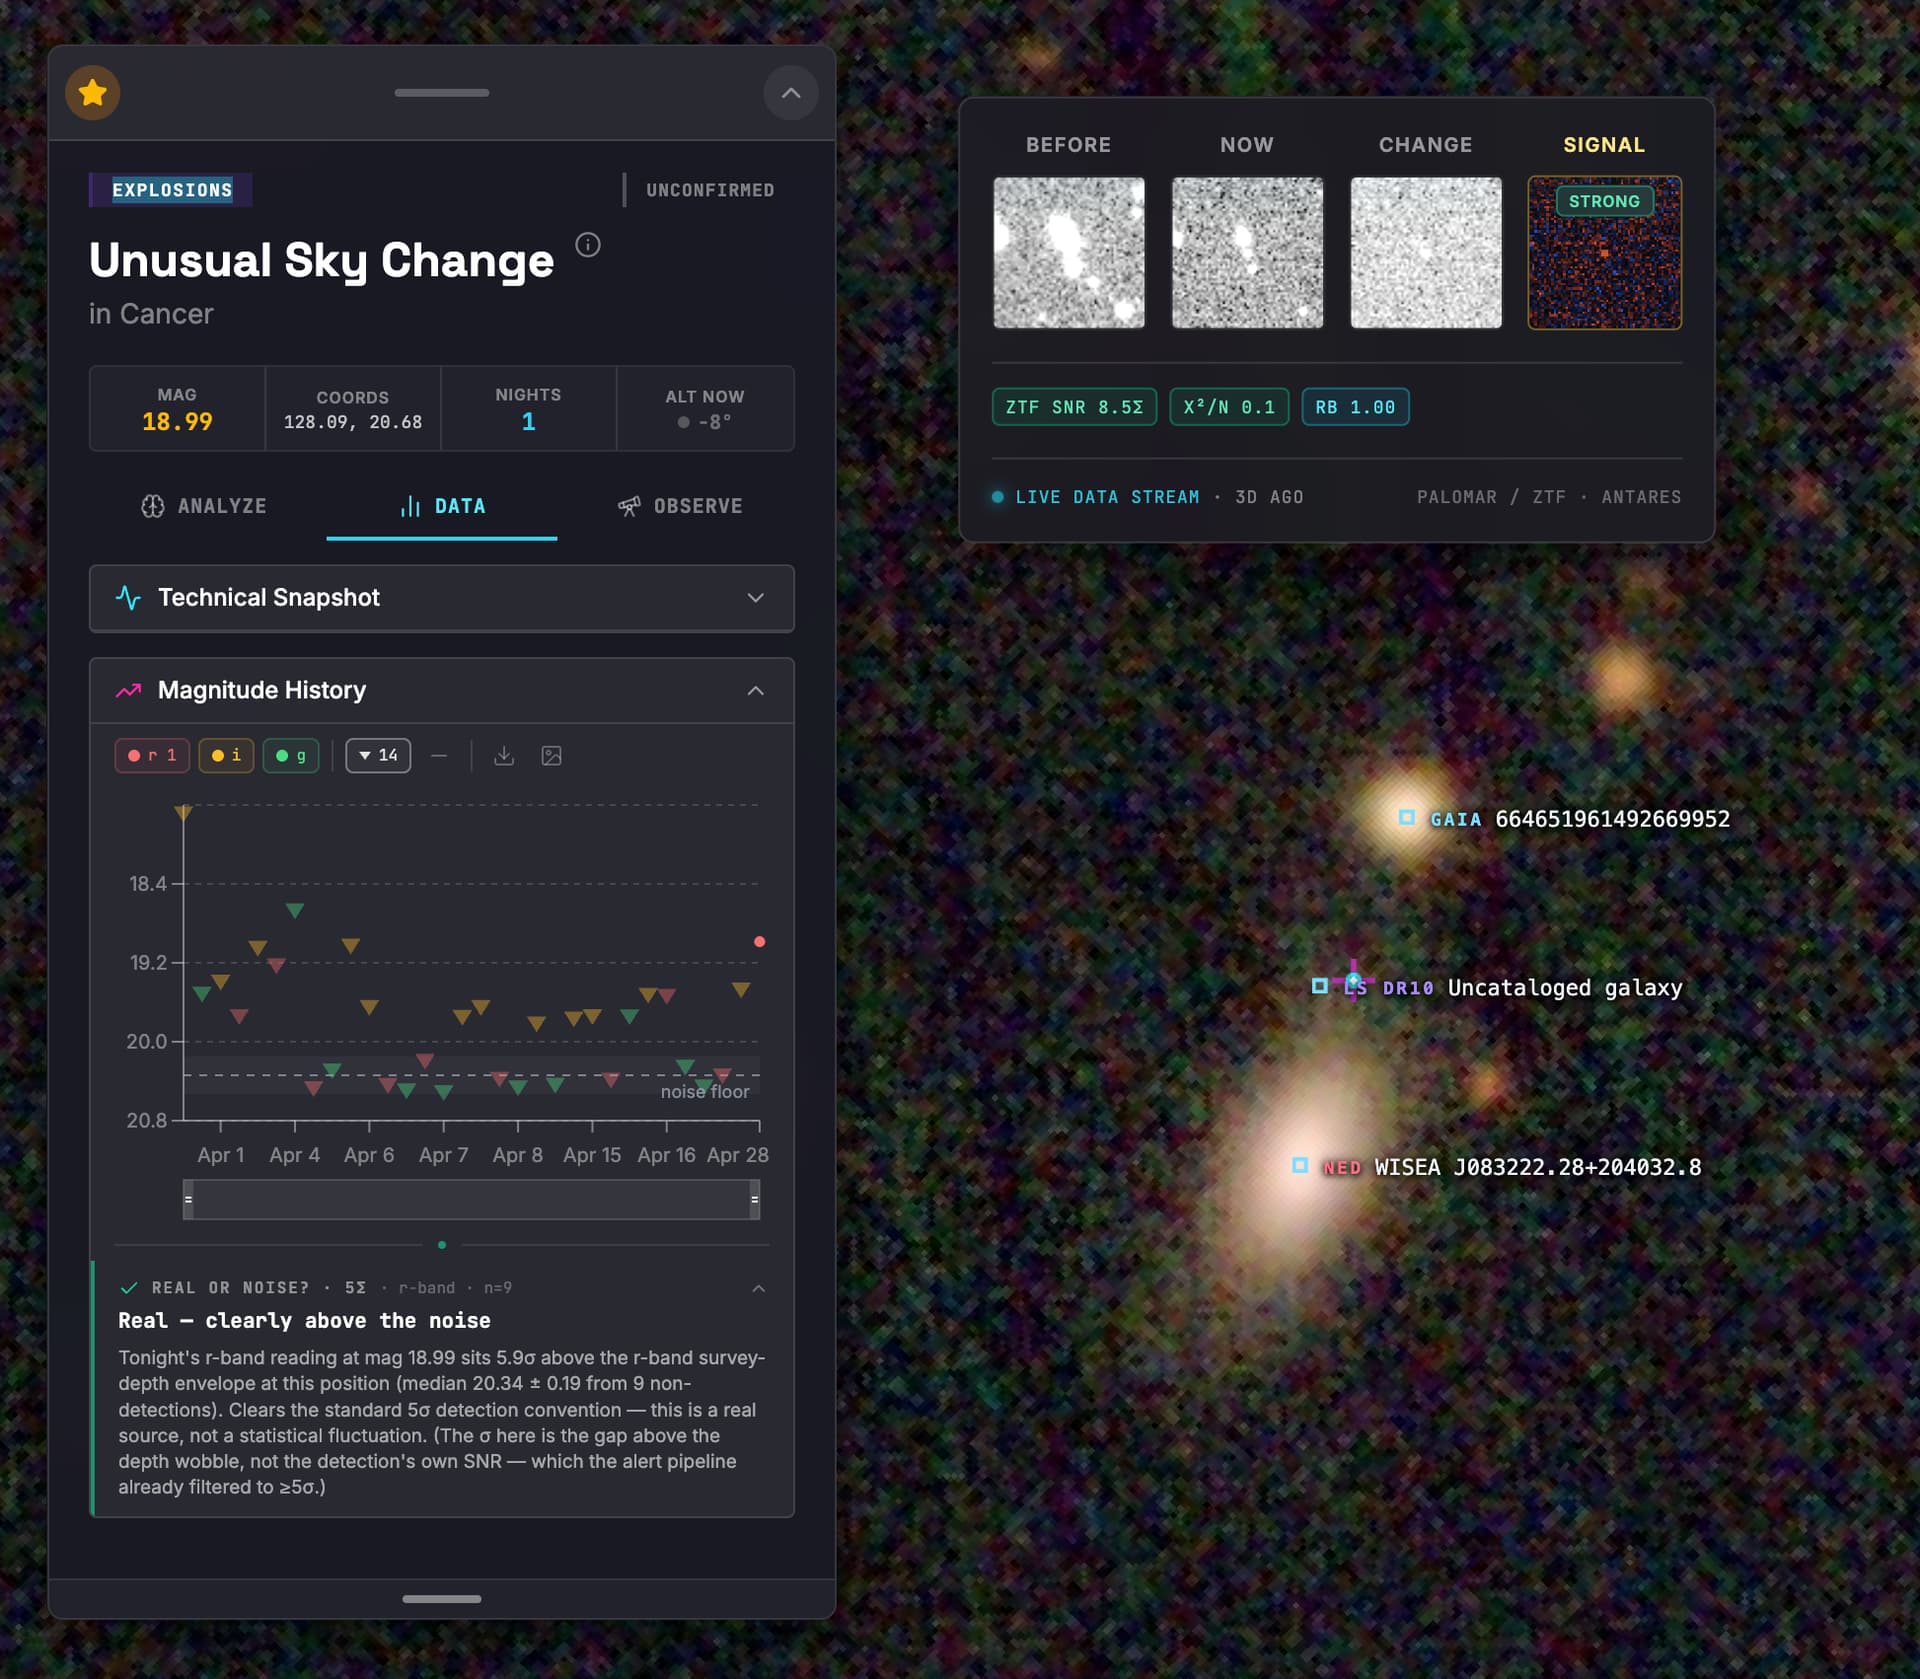
The target location appears to be in the extended range of the galaxy. However, when reviewing the magnitude history (including non-detections), it appears that the observation that generated the alert shows a very similar magnitude as prior observations (within the expected noise range), so it’s probably not of interest. Further data points are needed, though, as there’s always the chance that it was just catching the start of a brightening.
I see the filters down at the bottom of the screen for noise, recentness, magnitude, and altitude above the local horizon at whatever location has been set. Those should be very useful! In testing them, the only downside that I’ve noticed is that it seems to be filtering by altitude based on where the object is right now, instead of where it will be tonight when follow-up observations would happen. That means most objects that would be up tonight are filtered out during the day when observing runs are planned. Is there any way to have it filter by object altitude tonight, since that info is already present in the “Observation Planner” (in the Observe tab)?
Hi Kelly, I updated the altitude filter to reflect altitude tonight. Also I was thinking more about the light curve and implemented an algo to determine the statistical spread of non-event detections to determine a noise floor. Not sure how accurate it is given the small sample size but it gives another way of looking at it more objectively. Here’s another one that I just found VR Observatory Explorer
It’s been a while, but I’ve slowly been adding features to the app and fixing bugs. One issue I resolved was asteroids incorrectly appearing under the Variable Stars and Transients categories.
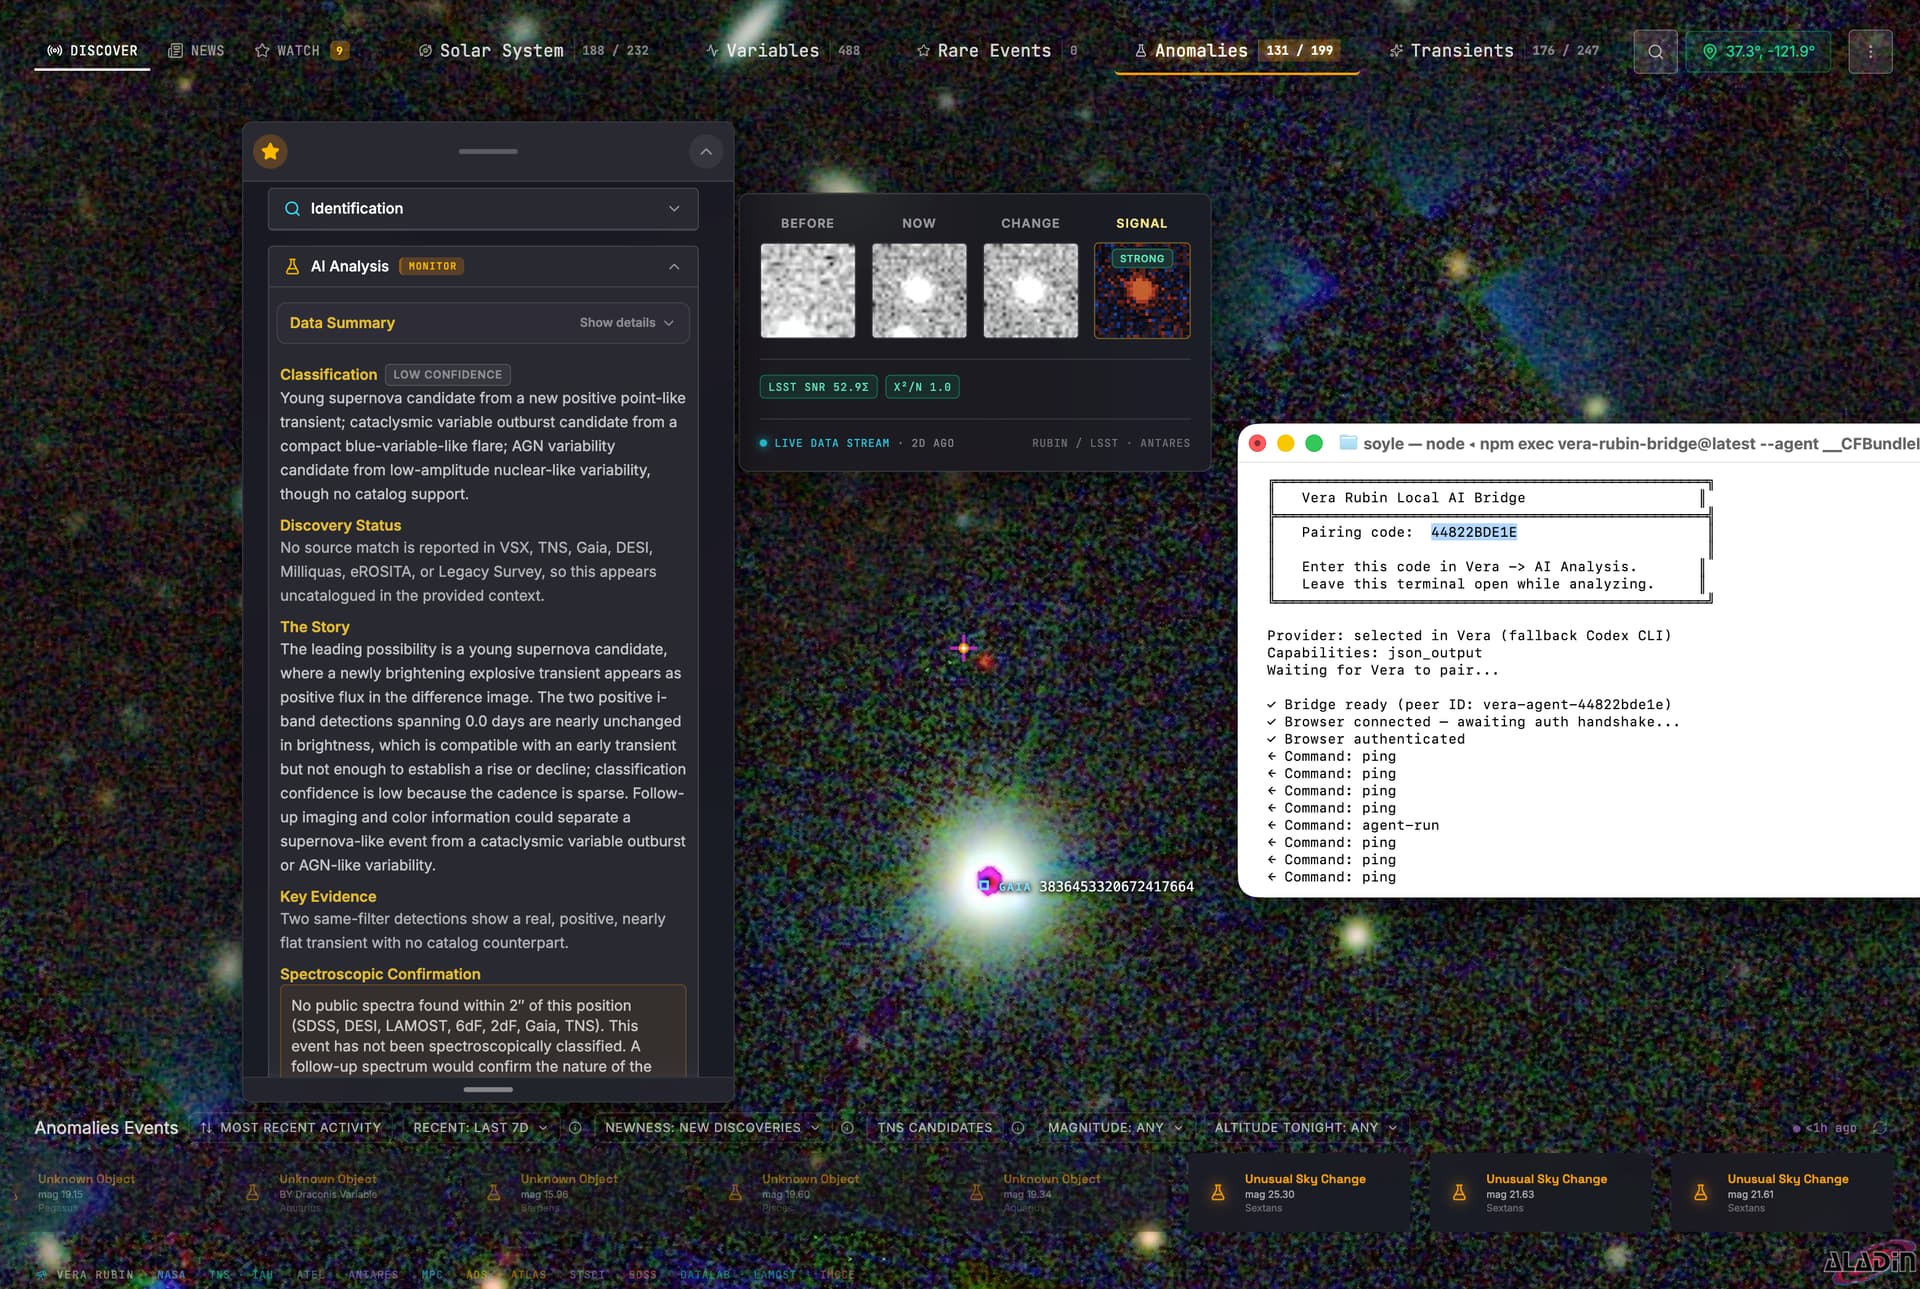
The latest feature is an NPM package I created that generates a WebRTC bridge between your local AI tools — such as Codex CLI, Gemini CLI, or Claude CLI — and the app. Previously, the app had a feature that let you analyze event data using the Gemini API, but I had to password-protect it because it used my personal API key.
Now, users can connect their own AI running in headless mode instead. My understanding is that this type of workflow is supported with Codex, but may be discouraged or against the rules with Claude and Gemini.
If the headless mode works, I may rework the whole app to have the AI analyze all the incoming events from Antares and Fink.
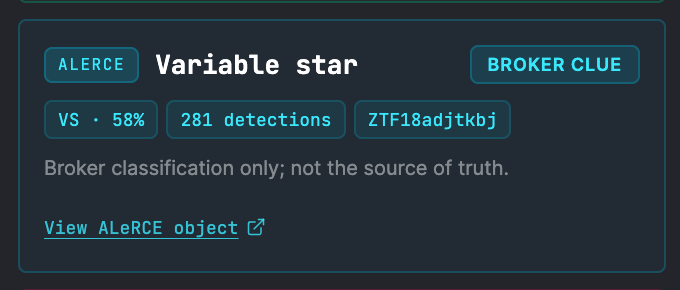
I just added ALeRCE broker support as an additional identification signal for events in the app. For now, it applies only to events with ZTF detections. Together with AI Analysis, this should provide more context and help users better understand what an event may be.
I greatly appreciate the additional information, especially since it includes a link to the Alerce page where the data can be further examined with ease.
I noticed that the eRosita links have been leading to an error page - the catalog I think you were trying to query looks like it was moved to viz-bin/VizieR-3?-source=J/A%2bA/682/A34/erass1-m instead of viz-bin/VizieR-S?source=J/A%2BA/682/A34, so that’s probably an easy fix.
I also see that there are “21/100” items being shown in the “Explosions” category, and “122/201” items in the Transients category, even though I’ve cleared all filters I am aware of. Recent=7D, Newness=Any, TNS unchecked, Mag=Any, Alt=Any. I tried changing my local lat/long, but no change. That’s an odd one, not sure what else to try from my side.
Hello Kelly, I fixed the filtering/count issue, so the category totals should now reflect the active carousel filters accurately. I also updated the eROSITA links to use VizieR-4 row view, which should make the source details accessible now.
This weekend I expanded Rubin Explorer’s discovery workflow so users can sort through many incoming sky alerts before opening them one by one. The app now prefilters events against existing catalogs and reporting systems such as TNS, MPC, and AAVSO/VSX, making it easier to quickly tell which alerts may be genuinely new and which are already known objects like reported supernovae, cataloged asteroids, or known variable stars. I also added a new AI-assisted multi-event review mode that scans groups of candidates and highlights which ones look most worth human follow-up, expanded the Discover feed, added clearer loading indicators, and fixed notification behavior so alerts are tied to targets that should be visible tonight from the user’s saved location.
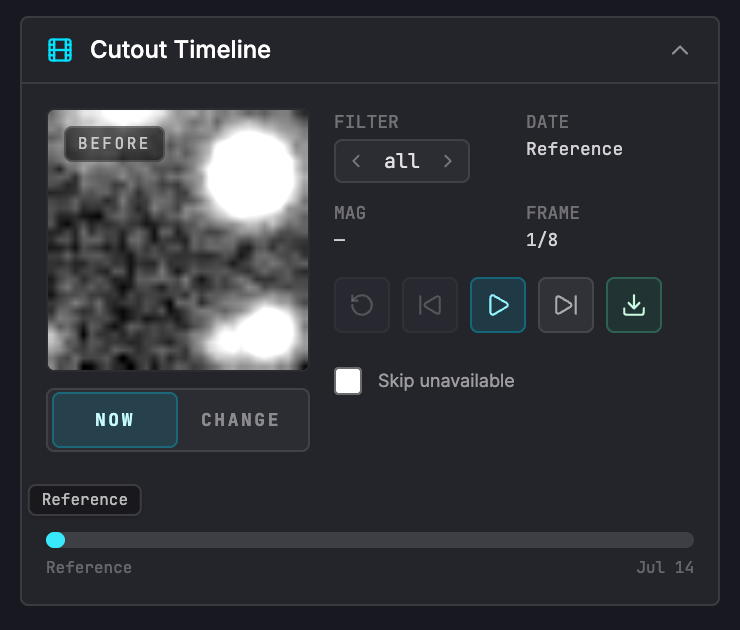
I’ve made some additional updates fixing usability issues with navigating events in the carousel and a new cutout/stamp viewer that creates a movie (webm) of an object overtime using the stamp images. You can access it from the data tab below the magnitude history chart.
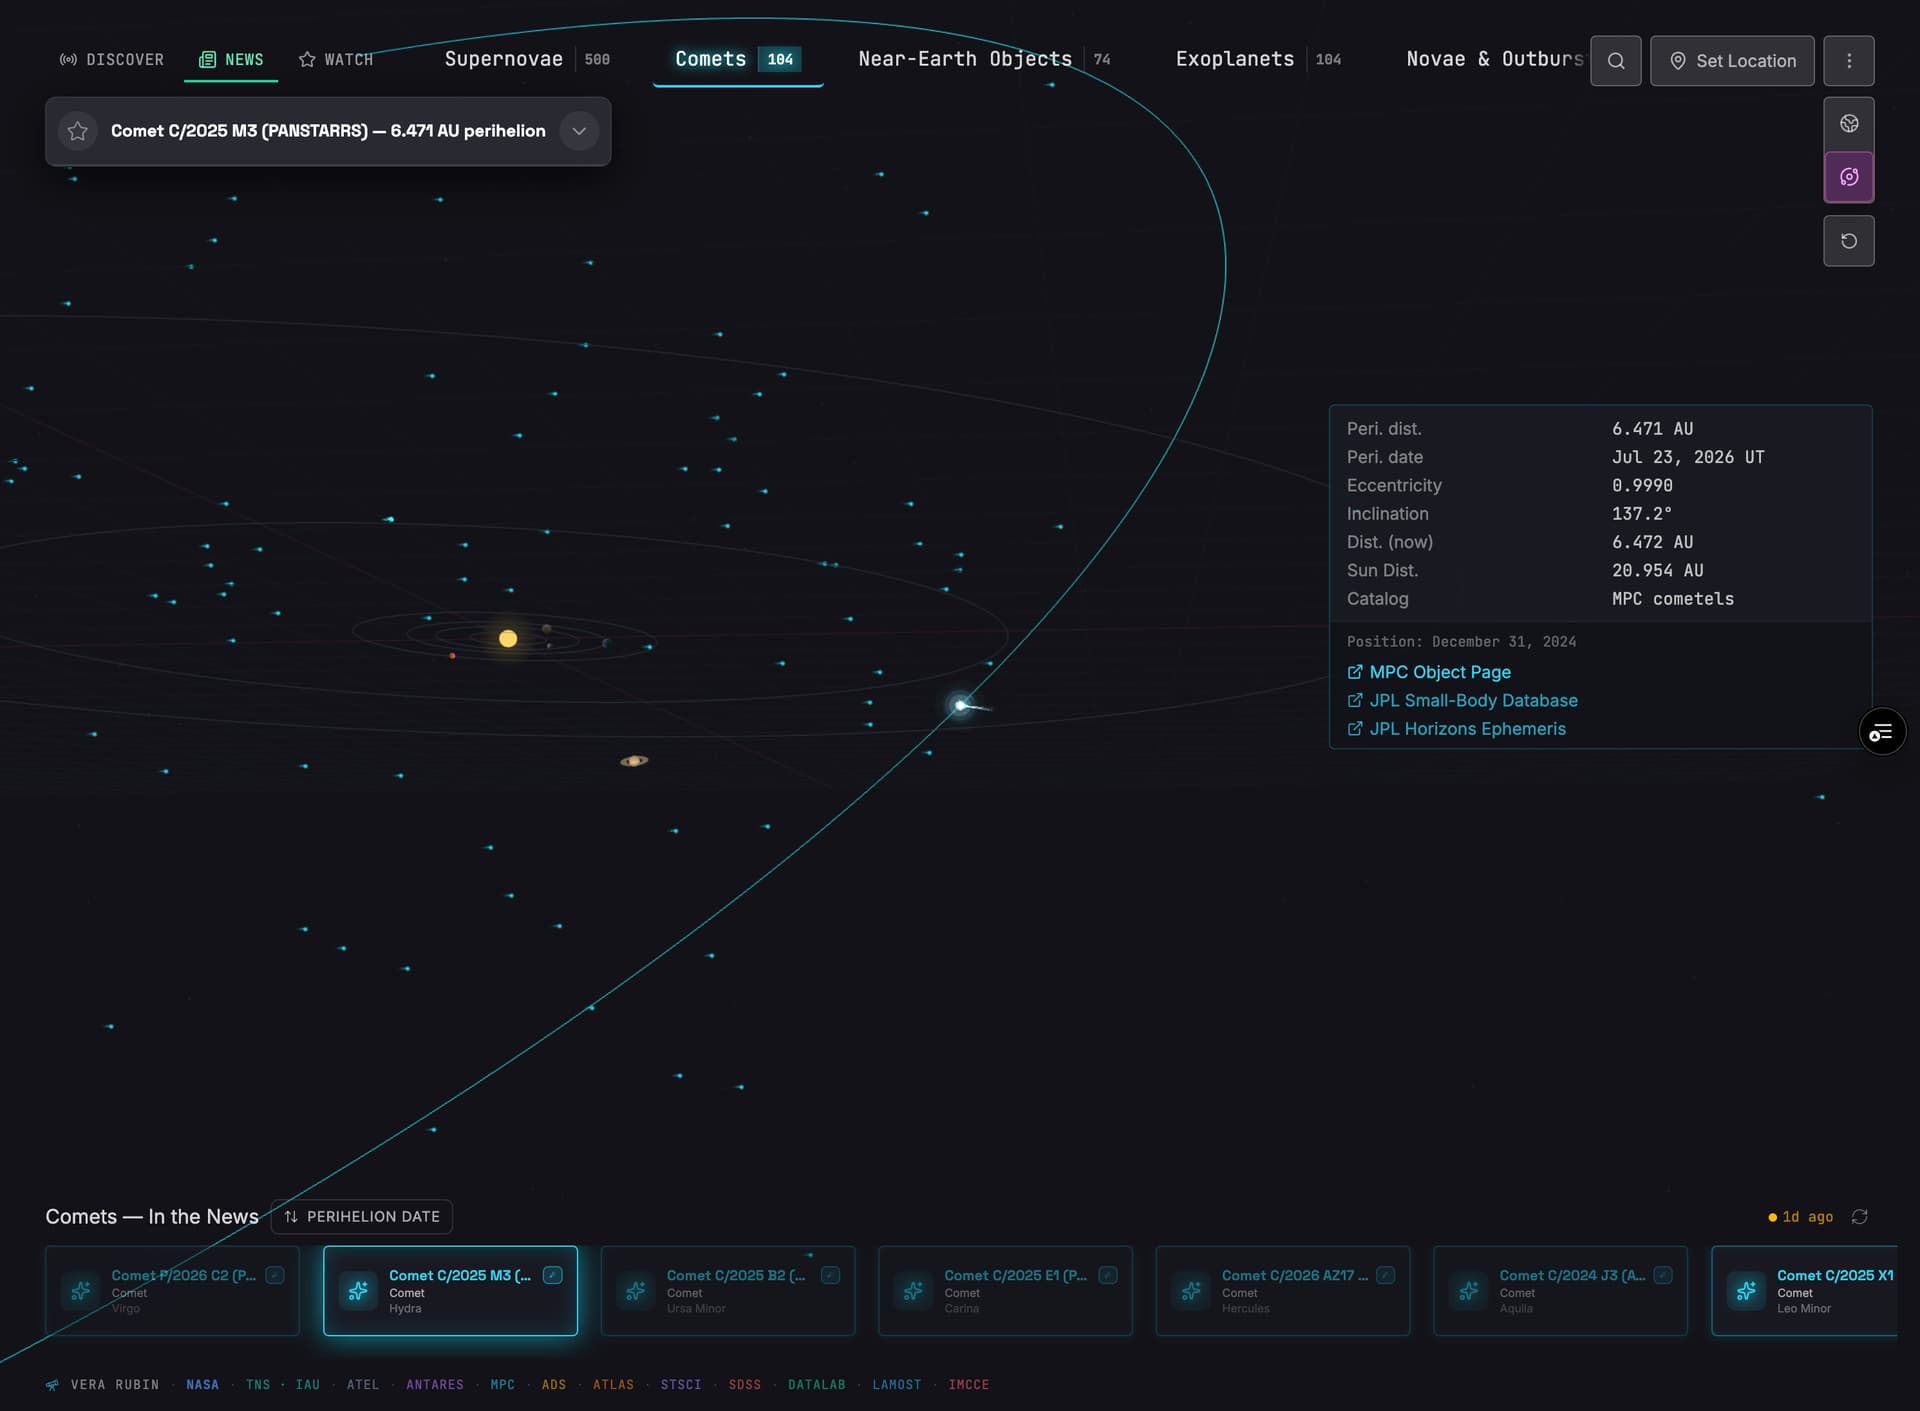
I’ve added a new interactive orbit view to Vera for Solar System objects, comets, and near-Earth asteroids. You can switch from the sky view to a 3D model of the Solar System, see where cataloged objects are located, and highlight an orbit by selecting or hovering over an event. The view can be rotated, panned, and zoomed while keeping the object’s observation and catalog information visible.
While working on this feature, I ended up building a separate project that tracks near Earth asteroids, comets, Earth-based satellites and solar system probes. My favorite part is the 3d models of the orbiting space telescopes which I downloaded from NASA. https://sso-simulator.vercel.app/
That’s a creative and useful feature. I really appreciate that you can filter it to a selected wavelength. Any chance a checkbox could be added in the Cutout Timeline window, so unavailable images could be skipped? Perhaps also an option to load a series of difference/change images?
I noticed one minor issue: when moving the date sliders in the Magnitude History window, they snap back to the maximum timeframe almost immediately, so a custom range cannot be set. The issue was present in both Chrome and Edge browsers.
Really appreciate this visualization tool and all your efforts!
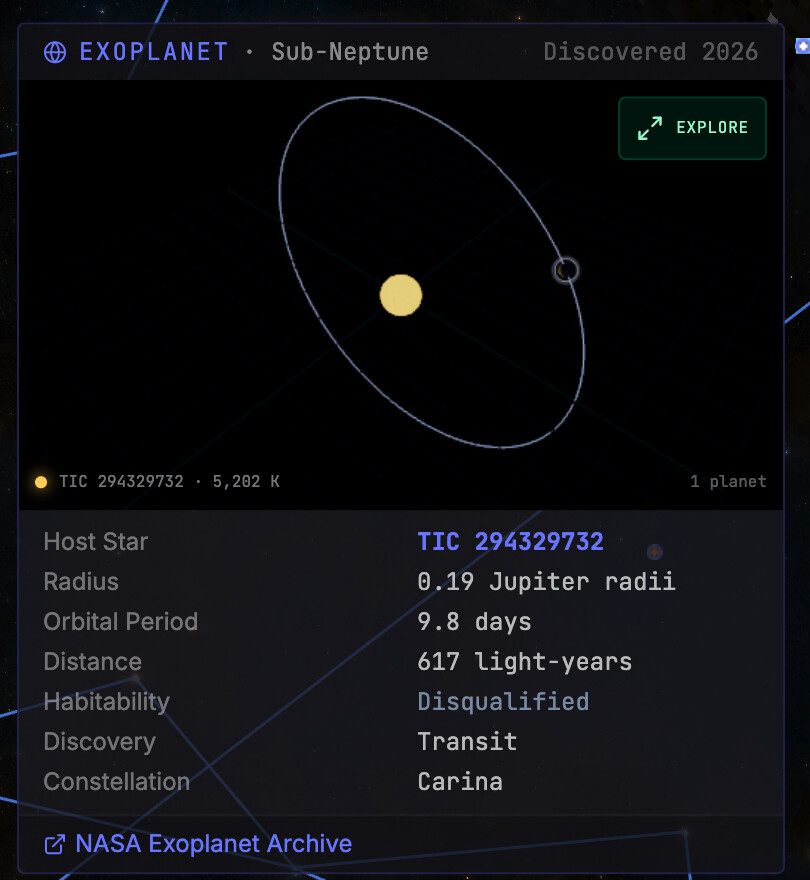
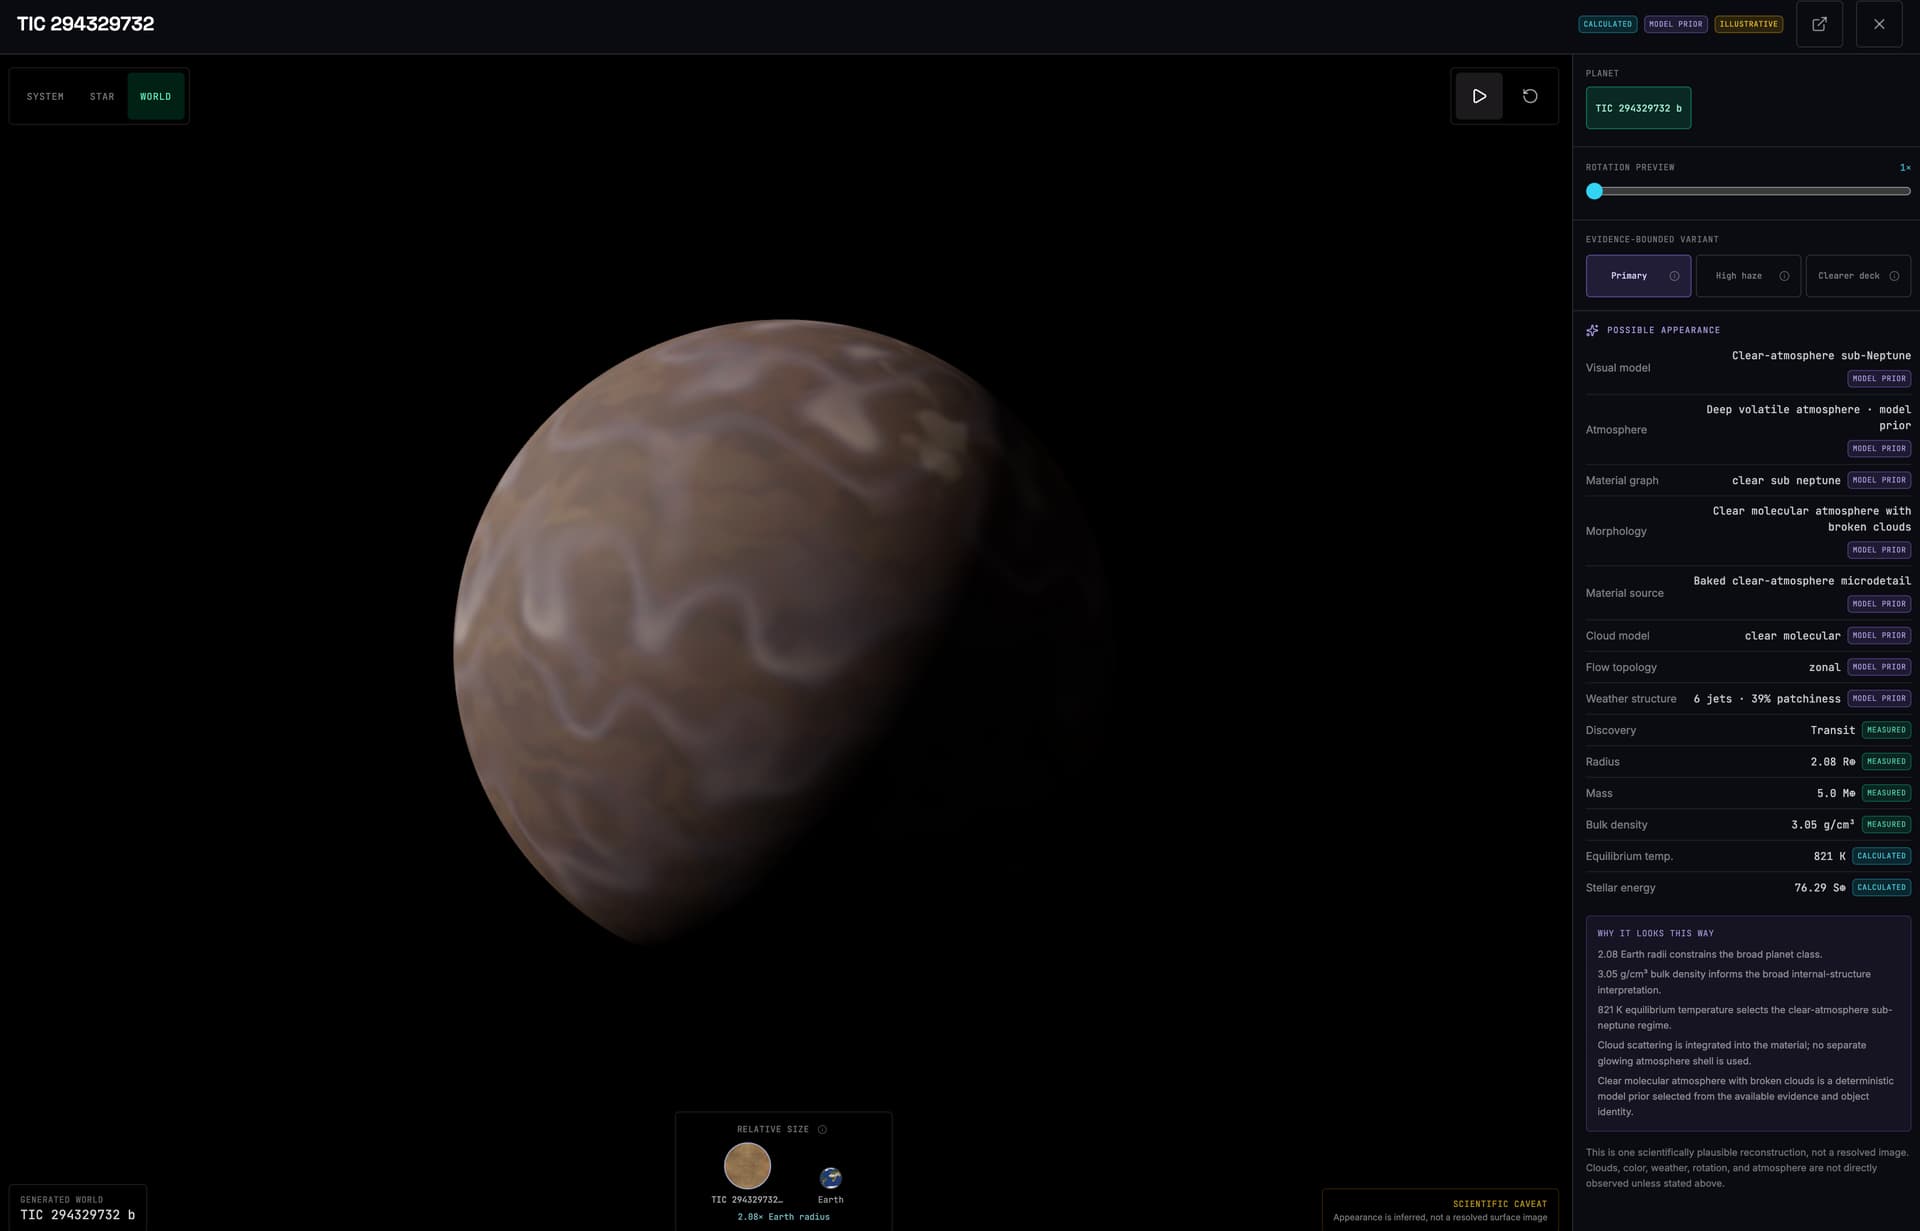
This is unrelated to Vera Rubin but I updated the Exoplanet feature in the News section of the app. I was curious about what the exoplanets looked like but only could see the basic facts about them—its size, density, temperature and orbit. I wanted to turn those numbers into something more visual, so I created an interactive 3D reconstruction of the planet, its star and the surrounding system based on the available scientific evidence. Select on the Expand button in the viewer to see the reconstruction. The data is pretty limited so there is a lot of guessing and assumptions being made but it’s a fun exercise nevertheless.