Hi everyone, I’m Marcelo Reyes. I’m an independent researcher working with Rubin
Data Preview 1 (DP1). I’d like to share a short and fully reproducible technical
note on astrometry in 47 Tuc; full repo on GitHub:
Context. I characterize early astrometric coherence in crowded 47 Tuc using
Rubin DP1 (ComCam) cross-matched with Gaia DR3. Aim: a simple, reusable baseline.
Data & method (reproducible)
- Symmetric 1:1 nearest-neighbor match Rubin↔Gaia within 2″.
- Gaia propagated from epoch 2016.0 to DP1 visits (2023-08-21/23; Δt ≈ 7.6 yr).
- Radial percentiles with 95% CIs via bootstrap (B = 5000; seed = 47).
- Per-coordinate residuals (Δα⋆, Δδ): per-axis RMS is quantitative context only;
I do not claim SRD compliance. - Null test: +60″ RA offset ⇒ 0 pairs ≤ 2″ (flat).
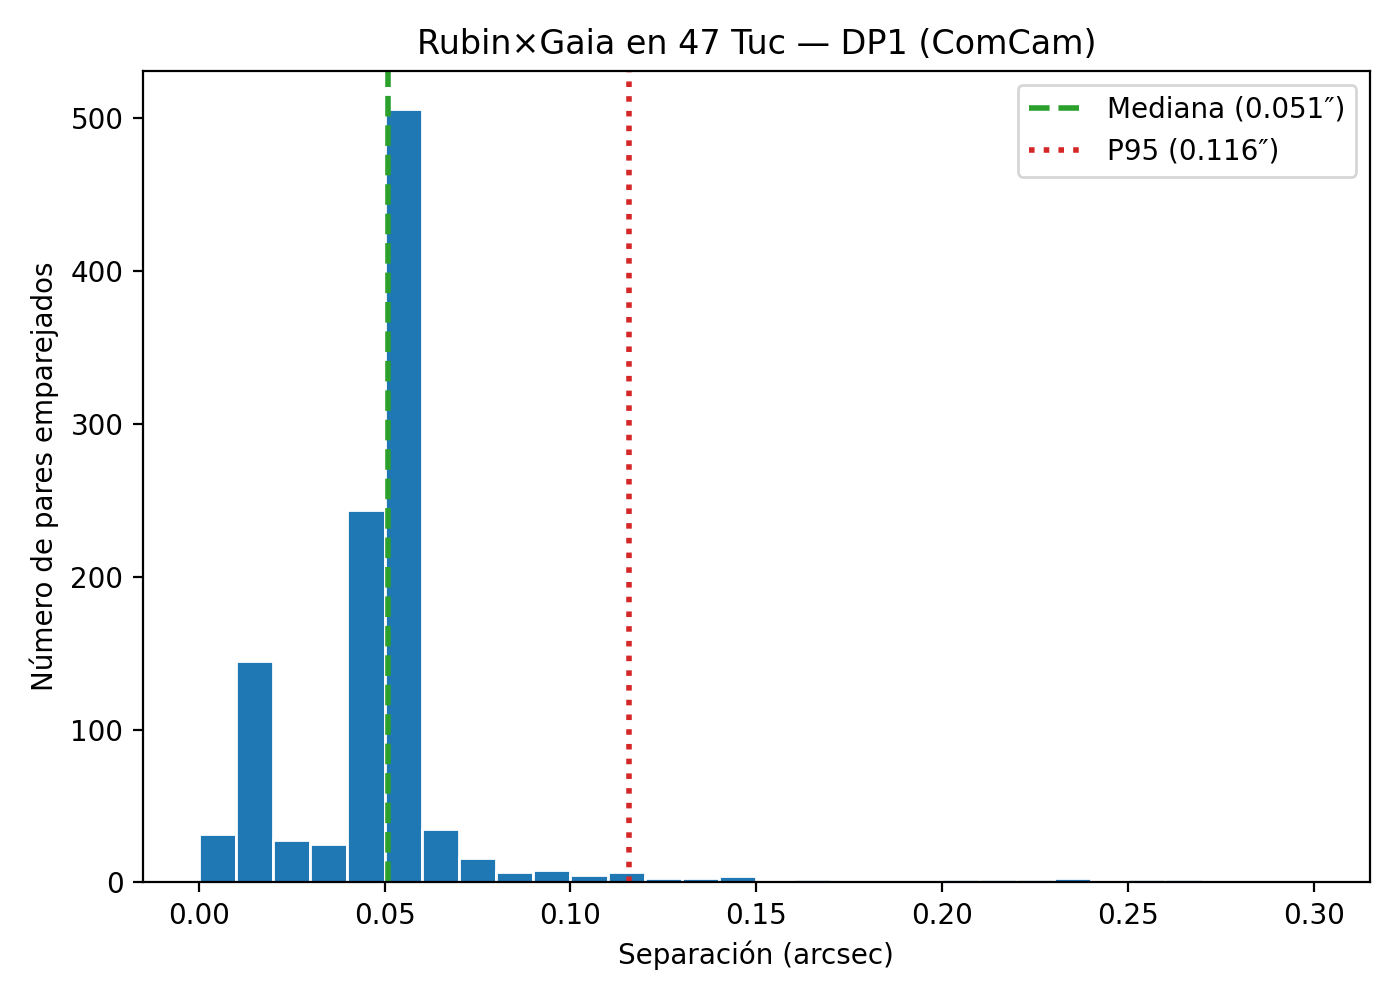
Key results (N = 1113 1:1 pairs)
- P50 = 0.05097″ [0.05069, 0.05143]
- P68 = 0.05333″ [0.05297, 0.05377]
- P95 = 0.11584″ [0.09781, 0.17069]
- Per-axis RMS (mas; 95% CI): RMS(Δα⋆) = 130.9 [97.7, 162.3], RMS(Δδ) = 146.9 [104.3, 185.4]
- Instrument scale: P50 ≈ 0.255 pix at 0.2″/pix (ComCam)
Robustness vs. match radius (same deduplicated parquet)
| radius (″) | N | P50 (″) | P68 (″) | P95 (″) |
|---|---|---|---|---|
| 0.4 | 1090 | 0.050877 | 0.053147 | 0.084029 |
| 0.8 | 1096 | 0.050970 | 0.053236 | 0.097704 |
| 1.0 | 1100 | 0.050970 | 0.053236 | 0.099700 |
| 1.2 | 1102 | 0.050970 | 0.053236 | 0.102142 |
| 1.5 | 1104 | 0.050970 | 0.053236 | 0.108180 |
| 2.0 | 1113 | 0.050970 | 0.053325 | 0.115842 |
Outliers (>P95)
- 56 pairs with separation > 0.116″ (CSV published) — no obvious clustering at first glance.
- CSV for inspection (RUWE, mag/color, detector location):
data/47tuc_dp1/rnA_outliers_gtP95.csv - Potential citizen-science follow-up / validation:
https://citizen-science.lsst.io/
Sanity check — Why is the per-axis RMS larger than the core percentiles?
This is not a bug but a real feature of the data: a small (~5%) yet extremely heavy tail in the separation distribution drives up the classical RMS.
-
Identity (sanity):
mean(r^2) = mean((Δα⋆)^2) + mean((Δδ)^2)
Holds to numerically consistent (abs diff ≈ 6.9e−18) on the published parquet. -
Core/tail split at q95:
q95 = 0.11583″,n_core = 1057,n_tail = 56,w_core = 1057/1113 ≈ 0.9497
E[r^2]_core = 0.002439 arcsec^2
E[r^2]_tail = 0.723691 arcsec^2(~297× heavier than the core)
Weighted mix reproduces the total:w_core·E[r^2]_core + (1−w_core)·E[r^2]_tail ≈ 0.03873 arcsec^2 ≃ mean(r^2). -
Robust (core-characterizing) per-axis RMS:
RMS_trim1%(Δα⋆) = 78.27 mas,RMS_trim1%(Δδ) = 58.57 mas
(These robust values reflect the core, while the classical per-axis RMS ~131–147 mas is inflated by the tail.) -
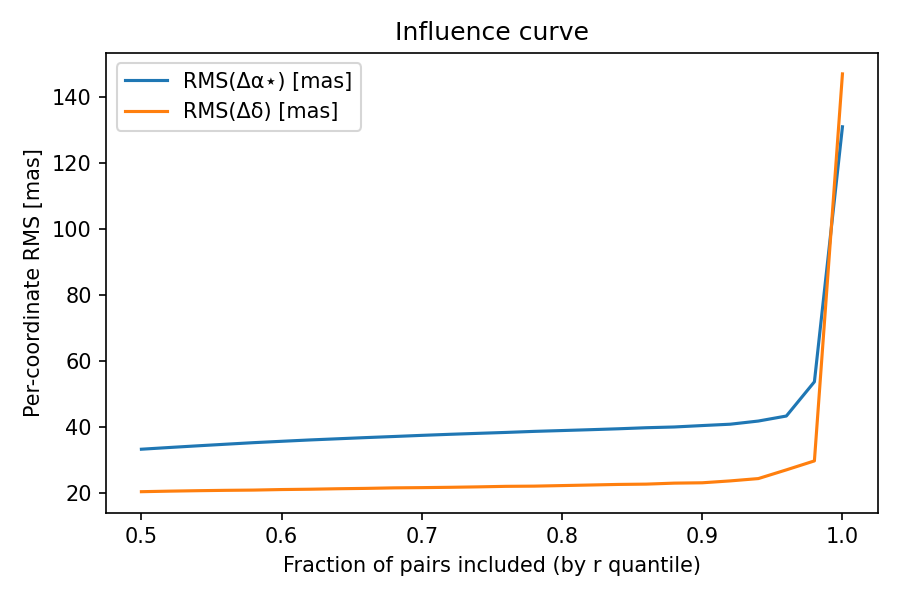
Influence curve: RMS remains flat through the core and rises only when the top-5% tail is included.
CSV: https://github.com/mreyes-astro/portafolio-rubin/blob/main/data/47tuc_dp1/rnA_influence_curve.csv
Figure: https://github.com/mreyes-astro/portafolio-rubin/blob/main/notebooks/47tuc/figs/rnA_influence_curve.png
Notebook (sanity / core–tail / robust): https://github.com/mreyes-astro/portafolio-rubin/blob/main/notebooks/47tuc/rnA_r2_sanity_and_influence.ipynb
SRD scope (LPM-17)
- SRD requirements are per coordinate; I do not perform an SRD compliance check here.
- Per-axis RMS is provided only as quantitative context for this field.
- SRD (LPM-17): https://docushare.lsst.org/docushare/dsweb/Get/LPM-17
Reproducibility
- GitHub ( release v1.0.4-rnA, with erratum): Release v1.0.4-rnA — RN-A Astrometry (47 Tuc, DP1) · mreyes-astro/portafolio-rubin · GitHub
- GitHub (latest, v1.0.5-rnA) — adds r² sanity, core/tail, robust RMS & influence curve: In preparation
- Zenodo (data/code; freshly uploaded, Sept 1, 2025):
RN-A — Astrometry in 47 Tuc with Rubin DP1 (ComCam) - Notebooks (repo):
notebooks/47tuc/-
rnA_per_coordinate_metrics.ipynb(adds per_coordinate + CIs to JSON) -
rnA_radius_robustness.ipynb(adds radii_check) -
rnA_outliers_analysis.ipynb(exports CSV >P95)
-
Figure (Rubin×Gaia histogram; 2″; 1:1 match)
Preprint / arXiv. I’m arranging endorsement for astro-ph.IM; I’ll update with the arXiv ID
once posted. Happy to discuss endorsement logistics via direct message.
Brief stats note. P95 and per-axis RMS CIs are wider due to the tail; bootstrap reflects this without
assuming Gaussianity. A magnitude/seeing-stratified variant is a candidate for a future iteration.
Thanks for any technical / reproducibility feedback (RSP/TAP/ADQL/bootstrap).
— Marcelo Reyes (Independent Researcher, Puerto Montt, Chile)