This is the first in what will hopefully be a series of Community posts where we are reaching out to the science collaborations to review the science metrics we have as we try and converge on a final survey strategy.
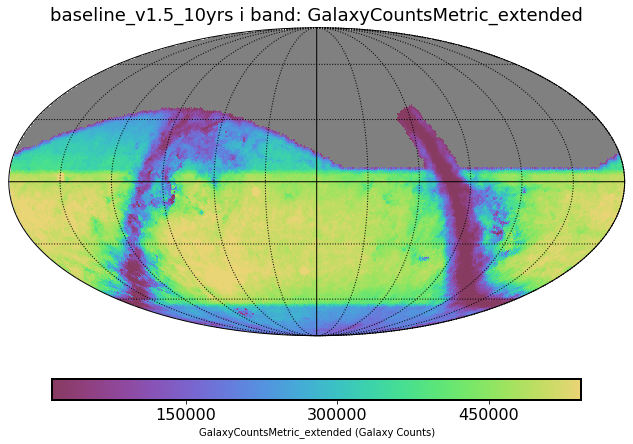
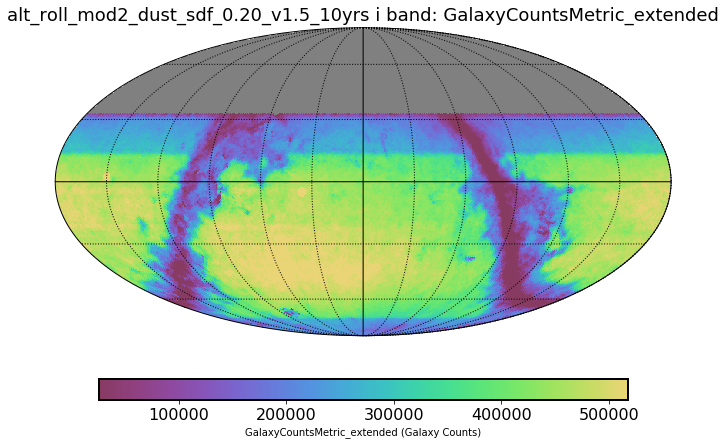
Currently we have very few metrics that touch on static extragalactic science. We have a metric that estimates the number of galaxies that we can expect in the final catalog, thanks to @humnaawan . Here are two examples of the output of this metric run on two different survey simulations. The simulation that uses a footprint that avoids dusty parts of the sky gets 13 billion galaxies, while the baseline only gets 12 billion.
Two more potential science metrics that I can think of:
The ability to fit stellar populations in LSB streams. This will be sensitive to the relative depths of the different filters. This is currently being driven by photo-z accuracy, but it would be nice to have more metrics on this.
Perhaps more for the Milky Way and Local Volume group:
2) How well LSST can measure resolved stellar populations in nearby galaxies. There was a white paper by Bell et al that discussed this and argued for more g-band observations. This could also be sensitive to how agressive we are at ensuring all parts of the sky are observed in good seeing conditions.
Point-source sensitivity is a strong function of seeing FWHM. That affects the ability to measure resolved stellar populations, as well as the ability to de-blend galaxies. Having deeper “priors” of where the peaks are from a few observations taken in great seeing can probably improve the overall photometry and de-blending. The redder bands will tend to be more crowded in both stellar fields and extragalactic fields (with the exception that the blue bands will show more clumpiness when looking at young stellar populations).
Without tailoring the observing strategy, on average one will get X% of the images taken when the seeing is in the Xth percentile of the best seeing. But there will be pretty large variations field-to-field and band-to-band in the first few years of the survey due to the relatively small number of pointings accumulated.
So there might be a significant science gain to taking advantage of the best seeing to get more uniformity of the “best seeing” fraction in a single reference band, especially in the first few years of the survey. For example, try to accumulate 20% of the i-band observations for every field in the 10th percentile of the best seeing (sacrificing the seeing slightly in other bands, of course, to achieve this).
If one wanted to get a bit more ambitious about optimizing, do this in both g and i, which might help get more leverage on the colors of the peaks or existence of very blue peaks.
I’m not sure how one can come up with a simple metric to test how significant the gains might be. Some sort of “forced photometry depth” might work. If detections used for forced photometry are based on chisq using all the bands and most sources are red, then getting better seeing in the red ought to improve this metric.
So right now, we have some simulations where we do try to get ‘good seeing’ images in a (variable number of bandpasses) — but we don’t have any metrics that would show this specifically is a benefit, beyond any incidental improvement in other metrics.
I understand that writing something for point-source sensitivity is hard … but is there anything that can incorporate the seeing directly into determining how many galaxies you might be able to identify vs. point sources? Or how many galaxies you could resolve? Or any suggestion where we can start?
The calculation of galaxy counts doesn’t really get at the confusion issue, although it is it is certainly a useful metric. It’s not obvious to me skimming the code how it is using seeing in estimating the limiting magnitude. It seems to be upstream of this module, but I couldn’t instantly trace it.
If the estimate of the limiting magnitude is using the number of effective noise pixels – (1/sum(sqrt(P_i**2))) where P_i is the normalized PSF in each pixel – and considering faint galaxies as basically point sources, then it’s already including seeing in the estimating the number of galaxies.
The seeing is used when calculating the m5 in the opsim outputs (using effective noise, yes) … then the m5 used here is just adjusted for dust extinction. So, yes, it’s included in estimating the number of galaxies here. Does the seeing figure (separately) into considering star-galaxy separation, or does it follow pretty proportionately to the m5?