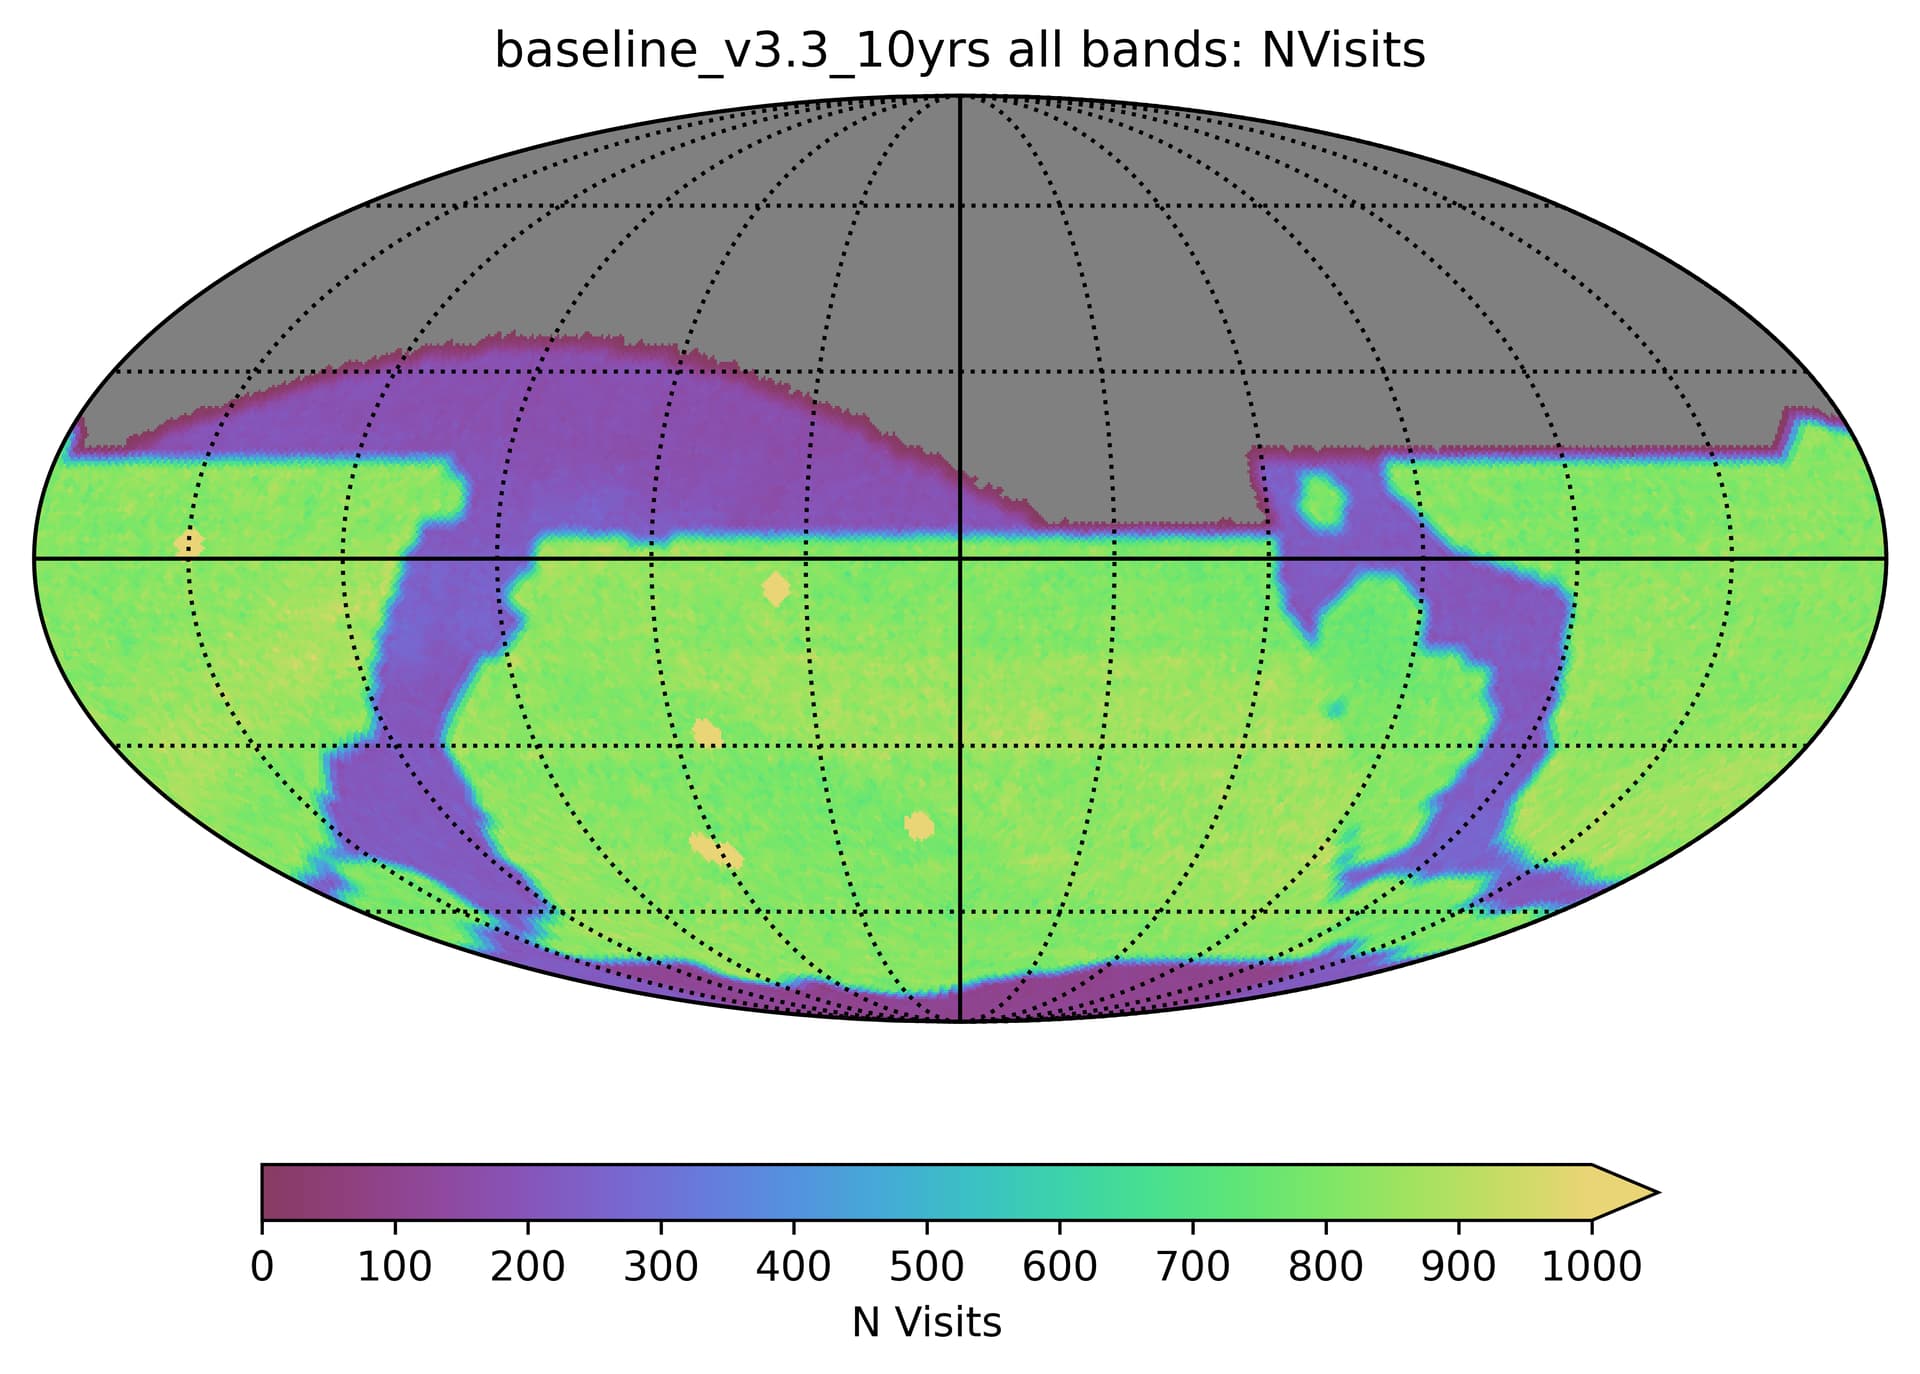
I’m interested in understanding the LSST baseline v3.3 survey simulation’s relative coverage in the extragalactic portion of WFD versus the Galactic plane. From this forum topic, I was able to find the following very nice HEALPix map color scale renderings of Nvisits:
Is there a convenient recipe/procedure for getting access to the actual HEALPix “backing data” for these plots e.g., as a FITS file or similar? Ideally I’d rather not start from the full simulation output to re-build the HEALPix maps myself. The HEALPix rendering color map seems to saturate on the low visit coverage end for the Galactic plane such that I’m not sure I can accurately eyeball the relative number of visits in the Galactic plane versus overall extragalactic sky in each band. In the cases of u and perhaps y, the 1d histograms adjacent to the 2d maps extend to low enough coverage values that they may provide the coverage fraction info I’m after, but that doesn’t appear to be the case for griz. Thanks very much.
I just put together a notebook - Survey Modes - to try to illustrate the baseline survey strategy for our new survey strategy documentation site (still a work in progress).
I suspect it has the information you’re looking for if you want number of visits per pointing in various regions, but if you still want the healpix maps as well, I can upload those too (they are created in that notebook, and will be in an ‘npz’ format that MAF can read). While you asked for fits files, we don’t actually create those, and I suspect (given that you would want the footprint information to be able to truly accurately fine the dusty plane regions, etc.) that the easiest thing to do would be to run something like that notebook anyway.
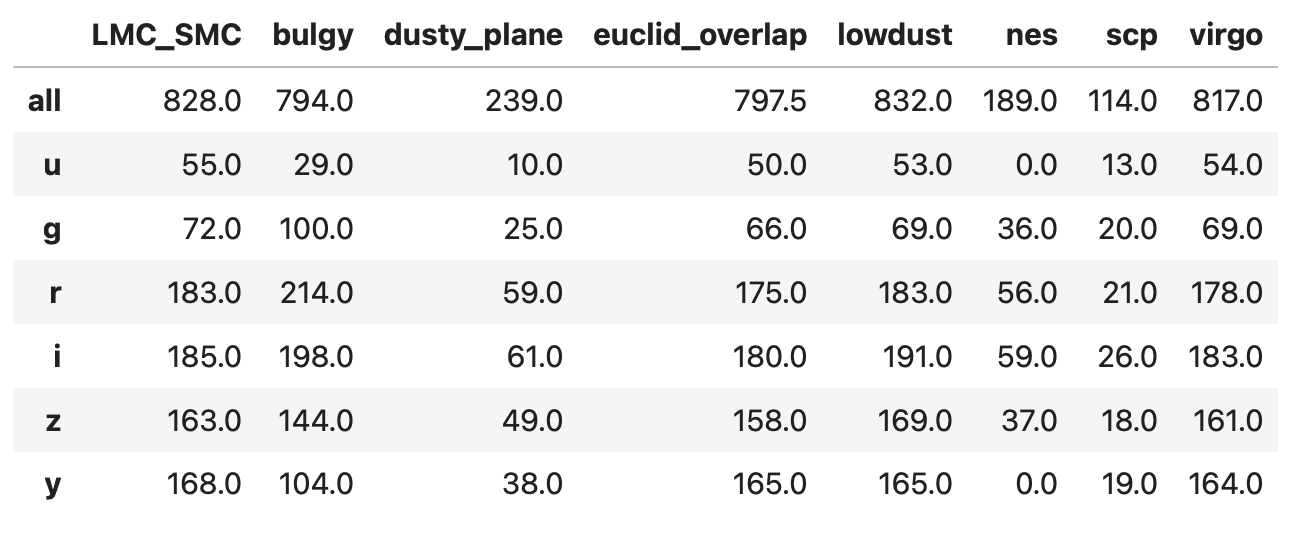
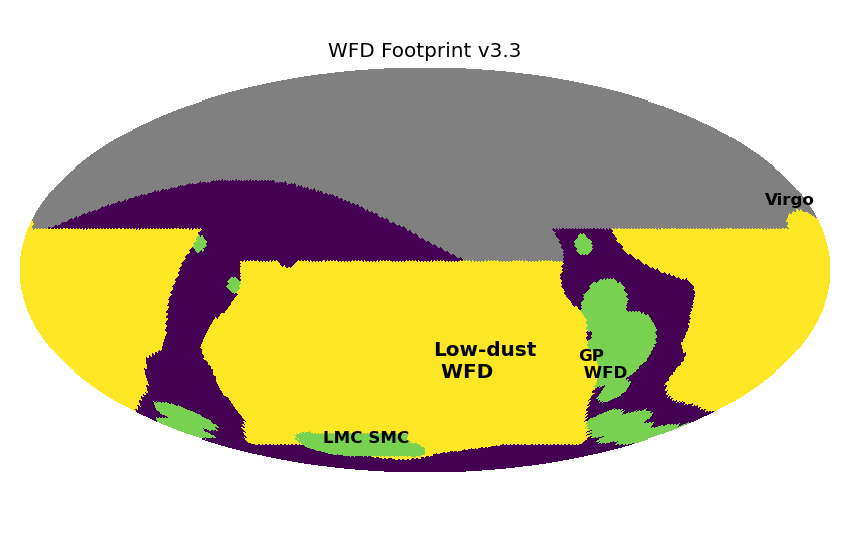
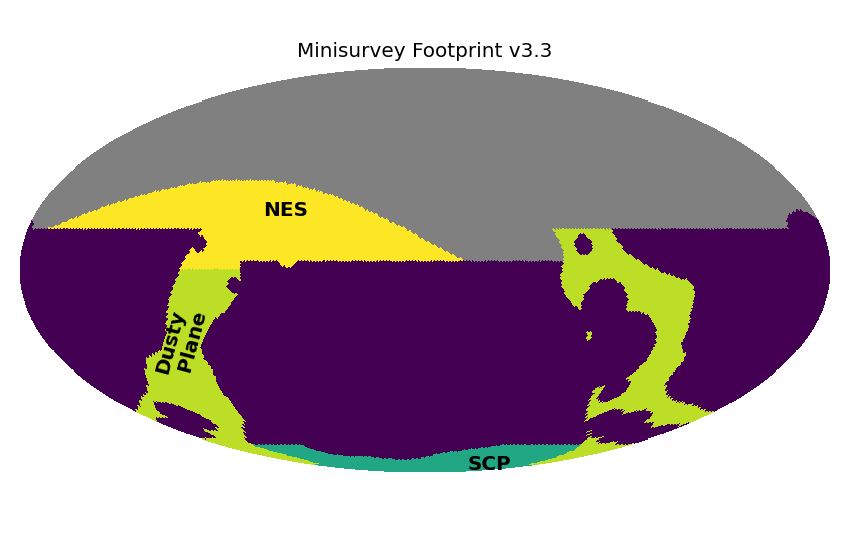
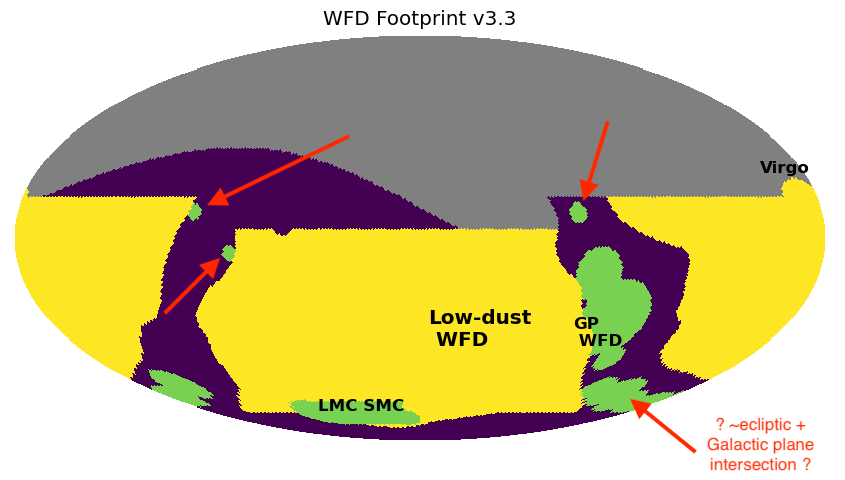
Median number of visits per pointing in each of the survey ‘regions’ on the sky (see plots of the regions, with better names, below. Note “bulgy” is “GP WFD”):
Thanks, Lynne, your table has exactly the info I was looking for! And the plots with region labels are also great. So as you suggest, I don’t think I want/need the underlying HEALPix maps, at least for now. One remaining question: What are the 3 ~circular green regions of GP WFD coverage embedded within the purple dusty plane region? I could imagine the ones at RA ~ 90 degrees having something to do with the overlap between the dusty plane and the ecliptic (though I might expect such an overlap region to look more contiguous/line-like, as it does near the southern intersection of the ecliptic and Galactic planes). Then I’m unsure about the one near-ish the equator and RA ~ 270 degrees. Thanks again!
It’s not related to the ecliptic (the ecliptic crosses the galactic plane quite a bit higher in declination), but rather getting WFD-level coverage on areas of the sky that are of interest to galactic plane studies but that are too high in dust extinction to be useful for extragalactic science. At v2.0 of the baseline footprint, this WFD coverage in the galactic plane was limited to a region surrounding the galactic bulge, but the SMLV group has requested coverage at a range of galactic longitudes, and this is where it evolved to in v3. Additional regions (the other little circles you have arrows to) have also been identified as high priority, motivated primarily by star formation investigations. I’ve colored them differently in the plot above because the distribution of visits between filters is different in these regions than in the low-dust WFD. There is a limited discussion in the SCOC Phase 2 recommendations, with an illustration in Figure 4.
The coverage in this area is still a work in progress, and is part of the work the Milky Way Coverage Working Group is trying to understand - they will have a progress report at the upcoming SCOC Workshop #4 if it’s of interest to you! The Fourth SCOC Science Collaborations Workshop.
Thanks, that all makes good sense. One of the two small ~circular regions of enhanced coverage near the Galactic plane at RA < 180 deg is well-aligned with the Orion molecular cloud complex. The other at RA < 180 deg perhaps includes the Rosette Nebula and/or Cone Nebula. It’s not immediately clear to me what the third such region — the one near (RA, Dec) ~ (290 deg, +8 deg) — is ,but I’ll ask SMLWV about it. Thanks again!
Great - that would be the place to get all of the details. We have a “priority map” coming from the combination of different science cases from the collaboration, and I could probably dig out which one was which - but you’ll likely get better information direct from the source.