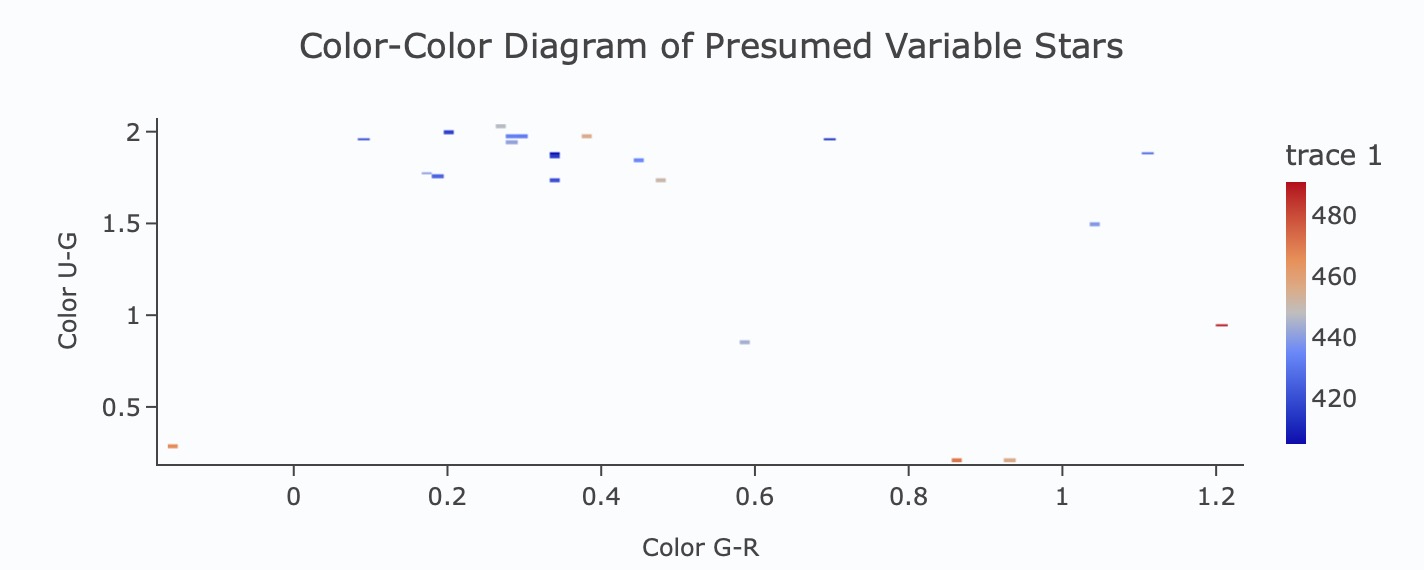
We’re working on color-color diagrams for constraining RR Lyrae within the data set and I wanted to ask about the regions of inhabitance for these stars. We are using a paper by Sesar et al. (https://iopscience.iop.org/article/10.1088/0004-637X/708/1/717/pdf) to help us in finding the region in color where RR Lyrae are typically found; this paper listed a g-r between -0.15 and 0.4, along with a u-g between 0.75 and 1.35. In the screenshot below, we graphed a range of presumed variable stars within a 50 degree field in an attempt to compare the data with previous literature on the subject. We were wondering if anyone else had done a similar project, or if anyone could shed light on the how colors and magnitudes work in the context of Rubin data.
Hi @mochaait, thanks for posting this. Could you clarify whether the data being used here is the simulated DP0.2 data set, or something else?
As a follow up, a bit more information on the term ‘presumed variable stars’ and how this plot differs from expectations would be helpful. In the context of Rubin data magnitudes and colors work the same as other surveys; a few more details here on what doesn’t seem to be working for you would be helpful, too.
A few weeks ago I analyzed data from the Sloan Digital Sky Survey that had RR Lyrae stars in it. It only contained colors and information on whether the star was RR Lyrae or not. There was no information on periodicity. I applied various machine learning classification schemes and Sesar+ to see how they worked, and they did pretty well! I haven’t tried it on the DC2 catalog yet, but maybe it’ll contain something useful for you, and I’d love some feedback. I stuck a copy on the Rubin Science Platform under /scratch/bobabel2023/RRLyraeClassify4.ipynb. Let me know if it’s helpful and/or if you have some suggestions.
Hi @mochaait,
We recently analyzed RR Lyrae stars in Milky Way globular clusters using Gaia data and specified the empirical location (and purity) of the instability strip for RR Lyrae. You can find the paper here:
Equation 4 would be particularly relevant, though the photometric bands used are Gaia’s G-band and Gaia Bp - Rp color. For the 5-95 interpercentile range we found:
0.31 < (Bp-Rp)0 < 0.67
0.27 < M_G,0 < 0.94
Cheers, Richard
Hello Dr. Graham! So, we used DP0.2 data to simulate this. We presumed the variable stars in the original plot I sent by using their light curves and periods, and compared said light curves to the ones found in tutorial 7b.
Admittedly we don’t quite know if this is the best approach, but it contained the StetsonJ index, a quantity we found to be consistent with data from the Sesar paper I listed. I should mention that they used SDSS to find RR Lyrae. Using TOTFluxMean in the u, g, and r bands in DIAObjects Criteria, as explicated by Tutorial 7b, we then mapped variable stars in the portal and notebooks. Constraining it from both the StetsonJ statistic and through color, we’re attempting to replicate their methodology to find RR Lyrae, but our colors seem to not be matching up with their paper.
After discussing further with our supervisor, we believe the constraints shouldn’t be too far off, and you said yourself that colors work the same as other surveys. We then tried mapping variable stars from parquet tables that had listed the applyRRly quantity to get an understanding of what was done to these stars. To find the colors, we used the given fluxes and converted them to magnitudes using scisql_nanjanskyToAbMag, and upon converting the fluxes to magnitudes subtracted by band (screenshot below)-- that is to say, it seems like the issue is with our approach and not with DP0.2 itself.
Image 6-4-24 at 11.28 AM.pdf (217.1 KB)
I appreciate the contributions from both Richard and Bob; we’ll look into those respective papers for more info. We will be proceeding by finding a way to join the DIAObject and Object catalogues to use calibrated fluxes from the Object catalogue, in an attempt to see if there are any changes with our results. We did confirm with the above plot that the variable stars plotted match our color parameters as listed by Sesar (that being g-r between -0.15 and 0.4, and u-g between 0.75 and 1.35), so if anyone has guidance on how we could approach the joining of those two catalogues or any other piece of advice, we would really appreciate it!
Thanks for all the help so far!
Hi @mochaait, thanks for confirming that DP0.2 was used for this – and for clarifying that the issue is not with DP0.2 (or the RSP). I have a few comments that might be helpful.
Re. “our colors seem to not be matching up with their paper”, there are differences between the SDSS and LSST filters which could be contributing here. The topic on “LSST Filters versus SDSS” might be relevant to your work?
Re. “…finding a way to join the DIAObject and Object catalogues … to see if there are any changes with our results”, there is no way to do an ADQL table join between the diaObject and Object tables. It will be necessary to cross match by sky coordinate, e.g., with the astropy.coordinates.match_coordinates_sky package (this notebook in the delegate_contributions_dp02 repo uses it in Section 2.3, if that’s helpful).