Metric for Differential Chromatic Refraction

I’m posting a summary of some work on DCR in advance of the metrics
hack session on Thursday as I’m interested in developing a metric
related to DCR.

Please see

Most of this code was originally developed by Tina Peters (while a
postdoc at Toronto) and Bee Martin (undergrad at Drexel). However, we
no longer have the benefit of their time, so some help is both needed
and welcome.

The basic idea is this. Non-powerlaw spectral features can
significantly change the effective wavelength of the u and g
bandpasses, thereby shifting objects on the sky in those bands from
the position one expects from a source with a power-law SED with the
same color. Taking advantage of these offsets in SDSS data is
described in Kaczmarczik et al. (2009), developing on a method
originally suggested by David Schlegel.

LSST may or may not end up capturing DCR information in the same way
as SDSS (in the form of offsets relative to a fiducial bandpass).
Indeed it almost certainly will not. I claim that this doesn’t matter
for the sake of computing a metric. The information content is
ultimately the same whether we are talking positional offsets or
subband magnitudes (https://dmtn-037.lsst.io/).

So, what we are doing is looking at how the positional offset changes
with airmass. Specifically plotting the positional offset vs. tan Z
(where Z is the zenith angle) and computing the slope. Quasars at
different redshifts have different slopes as compared to quasars at
other redshfits (and from stars, galaxies, SNe, etc.). In principle
the metric doesn’t even need to refer to quasars at all – it can just
be computed relative to DCR slopes.

In practice, we take a simulated quasar with a known redshift (and
thus known slopes in the u and g bands). We then take observations
defined by some opSim and simulate changes to the sky positions for
each epoch (where higher airmasses give larger positional offsets).
We can add errors based on the magnitude of the sources and the
expected astrometric error at that magnitude. (A “to do” item is to
calculate the relationship between astrometric error and magnitude in
the u and g bands.)

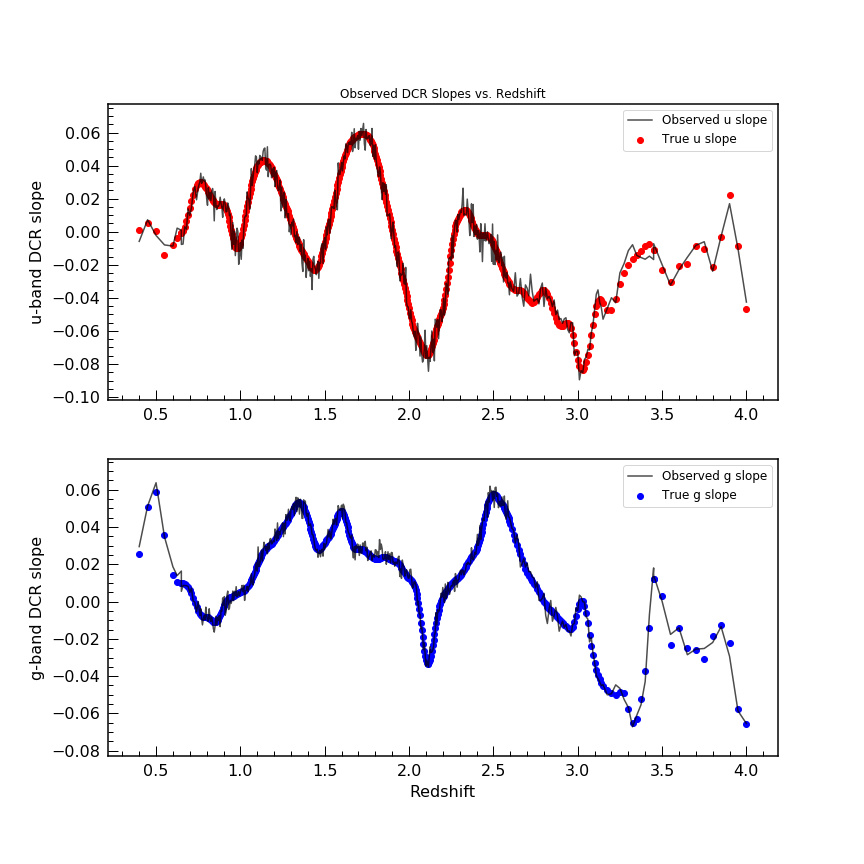
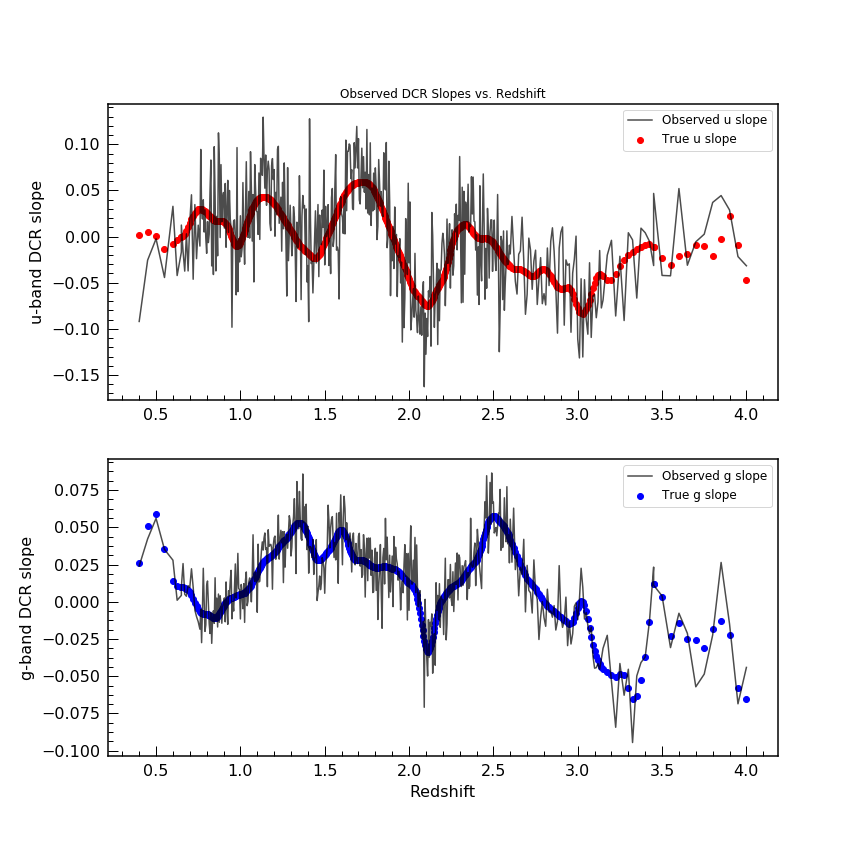
We can then fit a line the the offset vs. tan Z distribution,
computing the slope (the intercept is fixed at 0 by definition) and
compare that measured slope with the “true” slope.

The first two plots show the result of such a simulation with 2
different sets of astrometric errors – simulating very bright objects
and fainter objects.

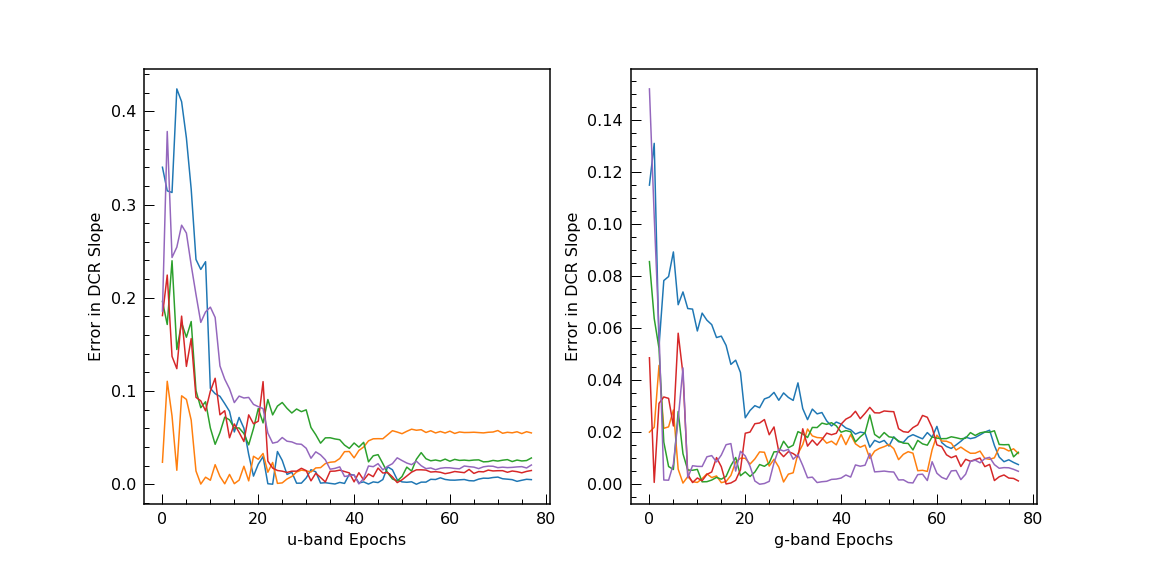
The next plot shows the improvement in the slope determination with
each added observation. From this it seems that nothing special is
needed to fully leverage DCR in LSST (that is there is no need for
twilight observations or high airmass observations). We make so many
observations (some of which end up naturally being higher airmass)
that the slopes are well constrained. However, different opSims will
have different airmass constraints and we should examine how this
impacts the information available from DCR by creating a formal metric.

This looks like a really nice start to a metric, @gtrichards.
Looking at the notebook, I was a little confused, but I think it’s my lack of understanding – the ‘true slope’ and ‘observed slope’ lines in the plots look very similar … but I guess the difference is the added astrometric noise due to SNR? Or something else? It seems like these include more than one evaluation of the noise (i.e. multiple versions of the random errors)?
In either case, is this the difference in the positional offset as a function of tan Z for the AGN vs. the positional offset as a function of tanZ for a flat SED (maybe that’s the same as the raw slope) or some other SED?

Some possibly helpful pieces: we do have code that will compute an approximate astrometric noise as a function of magnitude, observation m5, and seeing (I need to do a PR to add the FWHM, and change the docstrings, but FWHMgeom will drop in instead of 700mas): calculateAstrometricError (from sims_photUtils)
If you use many points on the sky, do you think you would need to do multiple instances of the random noise from SNR? Or just take one example per quasar and use many quasars?

I like the plots calculating how the result changes as you add more visits … I’m guessing these probably don’t need to be done for every simulation all over the sky, so being slow may not be so bad. They do seem useful in the case of a particular run being unusual, to investigate further, or to show why the high airmass DCR visits weren’t necessary in general.

I was a little confused, but I think it’s my lack of understanding – the ‘true slope’ and ‘observed slope’ lines in the plots look very similar

That’s for 2 different astrometric errors. One representing about the best LSST can do (in which case the true and measured slopes agree so well that one could do quasar photo-z from DCR alone), and one representing an astrometric error more like SDSS had.

In either case, is this the difference in the positional offset as a function of tan Z for the AGN vs. the positional offset as a function of tanZ for a flat SED (maybe that’s the same as the raw slope) or some other SED?

That’s the SED of the AGN vs. a power-law SED.

Some possibly helpful pieces: we do have code that will compute an approximate astrometric noise as a function of magnitude, observation m5, and seeing, [calculateAstrometricError]

Fantastic! – I had not realized that.

If you use many points on the sky, do you think you would need to do multiple instances of the random noise from SNR?

My inclination would probably to keep the astrometric error fixed, so that the number of observations and airmasses of them is what is coming through in the metric, but then do run it again for multiple astrometric errors. But I could imagine it going a number of different ways.

Another thing to consider, I worked with @isullivan and put together this MAF metric that looks at the precision you can fit the DCR offset of an object. It’d be great to take a look at see if this captures what you’re looking for. We have simulations where we intentionally take observations at high airmass, so then we can check if that is needed to do DCR science.

1 Like

I’m afraid I won’t be able to attend the metrics hack session next week, but I am eager to help develop a DCR metric for LSST. I’ve been working on other problems lately, but a little while back I was working on a metric to quantify how well DCR would be constrained by a given set of observations. Here’s a notebook I made exploring two different approaches: https://github.com/lsst-dm/ap_pipe-notebooks/blob/tickets/DM-18416/DM-18416-DCR-metric-development.ipynb. I found the second approach more powerful and useful, so that is what I have been using, though I believe it might be challenging to use for an official observation planning metric. I wrote a cleaned up version of it here: https://github.com/lsst-dm/ap_pipe-notebooks/blob/master/dcrMetric.py

1 Like

Here are two notebooks that Weixiang Yu put togeThis text will be hiddenther that implement this method.


1 Like