Thanks for the recommendation @mjuric. I really like Aladin Lite too, but it seems to be an all-in-one sky viewer where the controls are embedded in a singular widget rather than breaking out the tools into individual widgets which can be mixed & matched depending on your needs. I could be mistaken, though, since I’m not super familiar with it.
One of our use cases is to create classroom activities focusing on a single topic. We’d like to add the ability to use real LSST data to complete the exercise but don’t want to overwhelm the student by sending them to an all-encompassing astronomy tool/interface. Rather, we’re hoping to expose just the data/tools they need to complete that assignment and keep them on the same web page. Thoughts?
I don’t have much first-hand developer-level experience with it; it may be good to contact their devs for further information. They’re quite a responsive bunch.
That said, I’d expect that ultimately our Firefly will also be able to do most (all?) of the things the Aladin Lite viewer can.
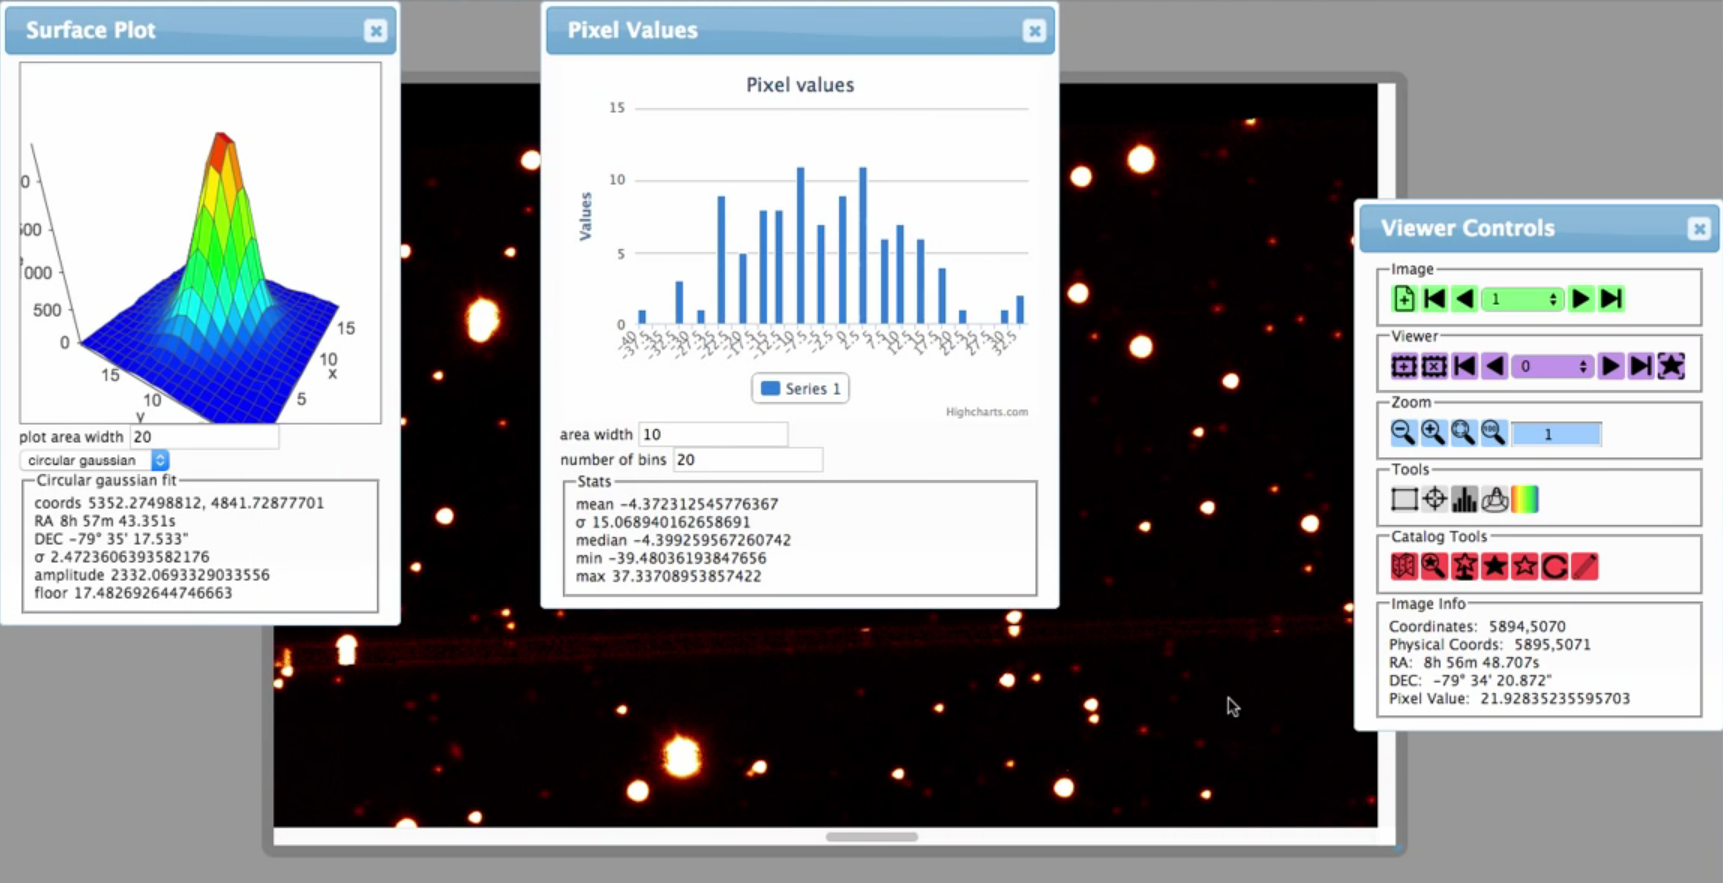
Note that the Firefly x-y plot viewer also includes histogramming. In the Python interface we are developing, the API will provide separate access to the two (i.e., to point plots and histograms).
Note also that name resolution, data discovery, and other functions mentioned above are standard features of existing Firefly applications. We are thinking about how to “widgetize” these for the LSST environment.
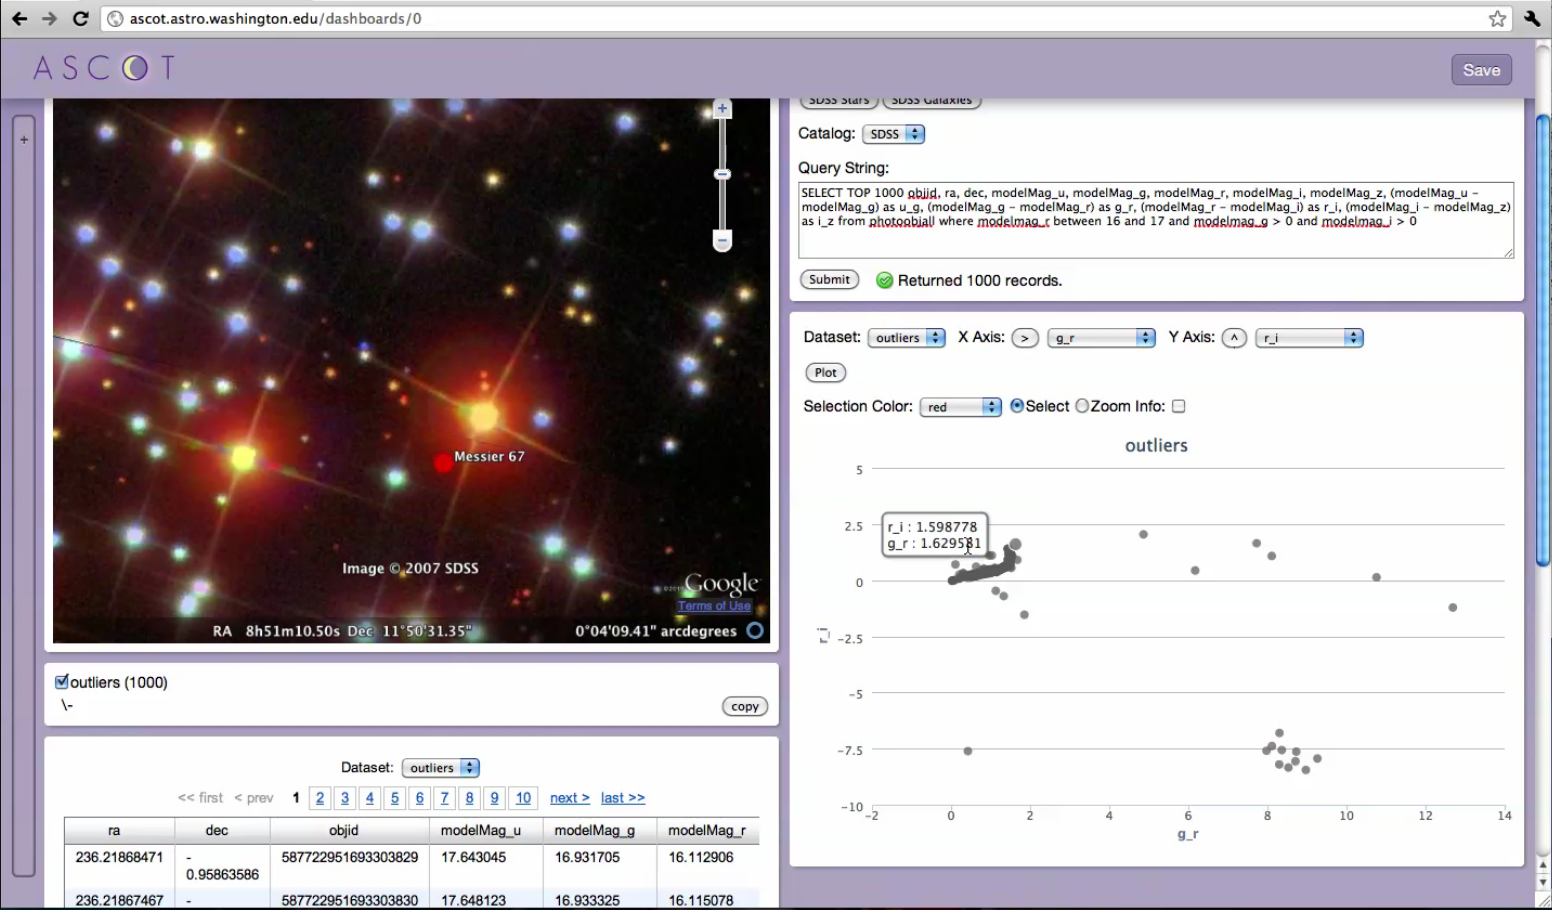
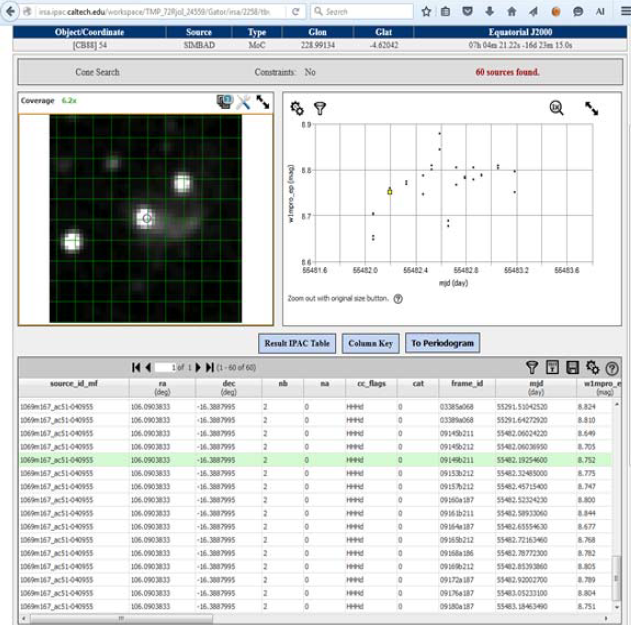
Right now it’s possible to plot a basic light curve in the X-Y plotter as a scatterplot of flux vs. MJD, for instance. We are planning on adding both display features such as calendrical axis labeling and computational features such as the ability to display folded light curves. Requirements in this area are driven both by LSST and by ZTF, which is also using Firefly for its archive (including PTF/iPTF).
Almost impossible (and this is probably generically true for scientific Python libraries), I’d guess, unless those converters are capable of converting Python code that uses NumPy (which I very much doubt, since NumPy is largely implemented in C).