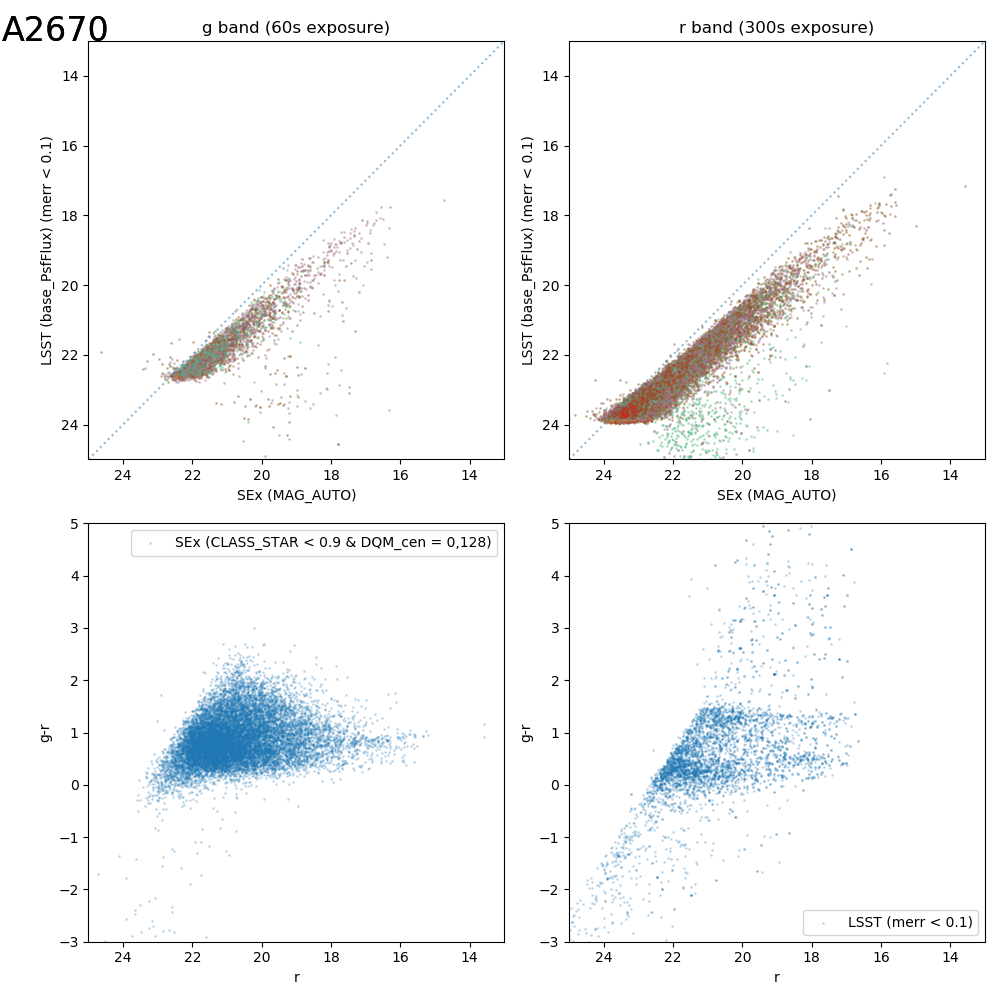
I ran obs_decam+ps1_pv3 on single-exposure DECam mosaics of Abell 2670 in g and r bands that I downloaded from NOAO archive. And I obtained offset and spread magnitudes (‘y-axis on the upper panels and lower right panel’) referenced to the magnitudes that I got through calibration using standard star observation data (‘x-axis on the upper panels and lower left panel’), and want to know why. I confirmed my standard-star calibration using SDSS and DECaLS.
Following is the procedure that I took to run obs_decam+ps1_pv3:
- used Docker container ‘lsstsqre/centos:7-stack-lsst_distrib-v20_0_0’ (I tried same procedure after installing ‘newinstall.sh’ and reproduced same results.)
- ‘source lsstLSST.bash(.zsh for newinstalled Mac)’, ‘setup obs_decam’,
- retargeted ISR following 6th item on https://github.com/lsst/obs_decam
- I put ‘dqmask’, ‘instcal’, and ‘wtmap’ files under three directories each,
- ingested by running ‘ingestImagesDecam.py DATA --filetype instcal --mode=link r/instcal/*.fits.fz’
- downloaded PanSTARRS1 catalog fits files that cover our data, ‘config.py’, and ‘master_schema.fits’ from http://tigress-web.princeton.edu/~HSC/refcats/ps1_pv3_3pi_20170110/, and saved in ‘DATA/ref_cats/ps1_pv3_3pi_20170110/’
- processCcd.py DATA --rerun processCcdOutputs --id -C my_config_file.py
- makeDiscreteSkyMap.py DATA --id --rerun processCcdOutputs:coadd --config skyMap.projection=“STG”
- makeCoaddTempExp.py DATA --rerun coadd
–selectId filter=r
–id filter=r tract=0 patch=0,0^0,1^0,2^0,3^0,4^0,5^0,6^1,0^1,1^1,2^1,3^1,4^1,5^1,6^2,0^2,1^2,2^2,3^2,4^2,5^2,6^3,0^3,1^3,2^3,3^3,4^3,5^3,6^4,0^4,1^4,2^4,3^4,4^4,5^4,6^5,0^5,1^5,2^5,3^5,4^5,5^5,6^6,0^6,1^6,2^6,3^6,4^6,5^6,6
–config doApplyUberCal=False doApplySkyCorr=False - assembleCoadd.py DATA --rerun coadd
–selectId filter=r
–id filter=r tract=0 patch=0,0^0,1^0,2^0,3^0,4^0,5^0,6^1,0^1,1^1,2^1,3^1,4^1,5^1,6^2,0^2,1^2,2^2,3^2,4^2,5^2,6^3,0^3,1^3,2^3,3^3,4^3,5^3,6^4,0^4,1^4,2^4,3^4,4^4,5^4,6^5,0^5,1^5,2^5,3^5,4^5,5^5,6^6,0^6,1^6,2^6,3^6,4^6,5^6,6 - detectCoaddSources.py DATA --rerun coadd:coaddPhot
–id filter=r tract=0 patch=0,0^0,1^0,2^0,3^0,4^0,5^0,6^1,0^1,1^1,2^1,3^1,4^1,5^1,6^2,0^2,1^2,2^2,3^2,4^2,5^2,6^3,0^3,1^3,2^3,3^3,4^3,5^3,6^4,0^4,1^4,2^4,3^4,4^4,5^4,6^5,0^5,1^5,2^5,3^5,4^5,5^5,6^6,0^6,1^6,2^6,3^6,4^6,5^6,6 - mergeCoaddDetections.py DATA --rerun coaddPhot --id filter=g^r
- deblendCoaddSources.py DATA --rerun coaddPhot --id filter=r
deblendCoaddSources.py DATA --rerun coaddPhot --id filter=g - measureCoaddSources.py DATA --rerun coaddPhot --id filter=r
measureCoaddSources.py DATA --rerun coaddPhot --id filter=g - mergeCoaddMeasurements.py DATA --rerun coaddPhot --id filter=r^g
- forcedPhotCoadd.py DATA --rerun coaddPhot:coaddForcedPhot --id filter=r
forcedPhotCoadd.py DATA --rerun coaddForcedPhot --id filter=g - rSources = butler.get(‘deepCoadd_forced_src’, {‘filter’: ‘r’, ‘tract’: 0, ‘patch’: ‘0,2’})
rCoaddPhotoCalib = butler.get(‘deepCoadd_calexp_photoCalib’, {‘filter’: ‘r’, ‘tract’: 0, ‘patch’: ‘0,2’})
rMags = rCoaddPhotoCalib.instFluxToMagnitude(rSources, ‘base_PsfFlux’)