I’m working on simulating SNIa objects that the LSST is expected to detect. For one part of the simulation I would like to generate the galactic coordinates for simulated objects.
Unfortunately, I can’t seem to locate information that would allow me to appropriately construct a sky density field that I could sample galactic coordinates from. The closest is the Kaggle PLAsTICC challenge here which provides simulated data for many classes of objects
I could use the Kaggle data to estimate the sky density field using the provided data for the challenge (using the train or test set? the datasets are imbalanced) and then draw coordinates for SNIa objects using that. I’m not sure if that would be appropriate or not in case the current survey strategy has changed enough since the challenge such that the expected sky density distribution of objects is now deemed to be significantly different from that provided by the Kaggle challenge.
I thought SNe would be uniformly distributed on the sky. Why not use a uniform distribution, then maybe apply some dust extinction and remove the objects that become too faint?
I think a uniform distribution would be valid, but because of the deep drilling fields there is some asymmetry. I suppose if I knew the relative ratio of objects detected by the deep drilling fields and the rest of the sky that should be enough to do what I need to do since I can assume a uniform distribution outside of those fields.
The way we’ve been doing this for several other transient populations is to Monte Carlo a large number of events, then use the simulated survey strategy pointings database to see which of those events would have been adequately observed.
Ooh … I think @rahmanw you may be looking for what is essentially the output of such metrics, rather than what should be the input population?
For example, most of our questions about survey strategy simulate an input population (a uniform distribution of SN), and then simulate what we could observe by evaluating when and how brightly the SN occurred, what was the timing and sensitivity of the observations to see if we could observe it (including things like the number of visits due to being in a DD field or not, whether there was dust extinction, the lunar phase, etc), and then check if there were enough observations to recognize the SN as a SN. It sounds like what you’re looking for is the number of SN detected/identified at each location on the sky (the output of this metric). Is that right?
Hi @yoachim and @ljones, very sorry for the late reply. Yes indeed, Lynn has the right idea, I am basically interested in the final output number density in the sky after all effects have been considered such as dust extinction, survey strategy effects etc have been applied. I’m not sure I want to go down the route of doing the full simulation myself to determine this, and it would make my life considerably easier if such a simulation already exist. LSST is well studied, so I feel one must exist somewhere!
The data from the kaggle challenge is the only one I know of, but i’ve not sure how much they’ve modified it so that it is suitable for the challenge and whether the number density of objects I estimate from it is realistic.
Perhaps a bit more information about what you’re trying to do with the results would be helpful though? For example, the standard metric output would tell you the number of SNIa expected at the end of the 10 year survey at a series of points on the sky. It’s not obvious that the resolution on the sky would be quite what you’re looking for, or if you need the number after 10 years or as a function of time, or if you are looking for the redshift distribution of SNIa as well or even something about how they’re detected - or other things that may be different than you’d expect.
Wow @ljones this is great! I am basically trying to implement this paper https://arxiv.org/pdf/1012.3195.pdf to calculate the expected ability of the future LSST data to allow us to concretely rule out certain cosmological models. It uses a fisher matrix formalism in a bayesian way. It also requires me to estimate a future likelihood from simulated data. To account for realisation noise, I also need to resample new objects from probability density functions that closely match what the LSST will give me which is why I need a current simulation to estimate all these PDF’s from.
For this estimated future likelihood, I only require a redshift distribution of objects and their positions in the sky. So the data expectation for the full 10 years is perfect (I suppose I can divide by 10 for a naive estimate of the 1 year data too if I needed it).
For the redshift distribution, I’ve for now assumed a dilday et al style (1+z)^1.5 distribution of objects which I sample from and then applied a magnitude cut of 25mags. Perhaps a bit naive, but if you know of a place where I can get a better estimate of the redshift distribution of objects that will be much appreciated!
My apologies if this is an obvious question - but how well connected are you to the DESC Observing Strategy Working Group? This metric came from their group and they would have much more information on how the input populations were generated. We can run the metric and provide you with the outputs, but interpreting them properly may be a lot easier if you are able to find out a little bit more from the original authors (we use much simpler results from it … such as “how many SNIa are detected in various survey strategies” and “does it impact the typical redshift of the SN detected”?).
Tagging @philippe.gris for more followup.
My apologies if this is an obvious question - but how well connected are you to the DESC Observing Strategy Working Group?
Recently, not very: I’ve continued to attend the regular zoom telecons (which have mostly been about responding to the referee report on the focus issue paper), but I have not been keeping track of what’s been going on in any greater depth than that.
Ah ,sorry for not being more specific Eric - the question was for @rahmanw, for some pointers on where to go for more technical information about what went into the information we could provide in the SNIa metric outputs.
Hi @ljones - unfortunately, i’m not very well connected at all. For sure, I think doing sensitivity tests and seeing how changing the survey strategy can impact the forecast i’m making on how LSST can discriminate between competing cosmological models is a good idea. Though I don’t think it’s fully necessary at the moment as based on initial tests, changing the inferred SNIa count slightly or the sky distribution does not affect things much because of the sheer number of objects LSST is expected to observe so my ability to discriminate between certain cosmological models doesn’t change and remains strong. Therefore, I don’t think I will need to consider asking the DESC group to provide me with more simulations or describe the input populations in more detail as the ones you linked should be good enough as a first guess and i’m grateful to you for linking it!
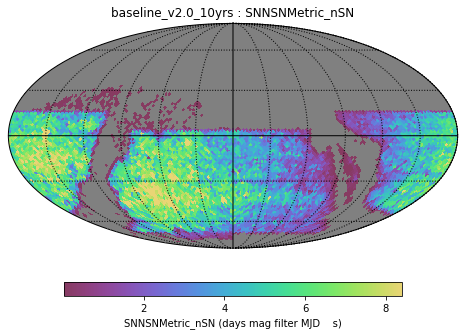
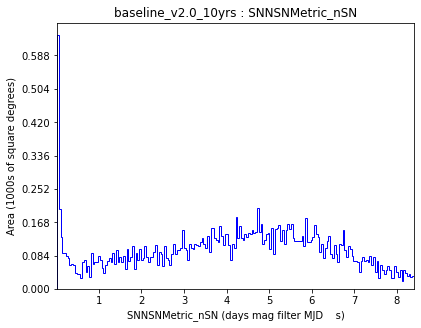
I made a higher resolution version of the metric output for you - you can download the results in the tar file below, if it’s helpful. (the npz file gives you the metric results - number of SNIa over 10 years - on an nside=32 healpix grid).
Wow, that’s really appreciated @ljones, thank you. If a paper results because of this investigation, I will be sure to properly to acknowledge your help provided!
Just a caveat about this plot. The number of supernovae are estimated up to z<zcompleteness. So this is NOT the total number of SN that will be observed by the survey.