Hi Rachel et al.-
I’m far from an expert on this, but when the WP call came out, I did some digging to educate myself, and here are some early descriptions/definitions of rolling cadence.
There was an NOAO/LSST cadence workshop in 2014: LSST Observing Cadences Workshop. On the workshop web site is a lengthy report that appears to document the emergence of the idea.
The working assumption for the LSST has been a universal cadence in a WFD (wide-fastdeep) main survey, in which all fields are observed with a similar cadence and pattern. A natural extension to this universal pattern is the “rolling cadence” where the region surveyed shifts as a function of time (Recent Cadence Experiments, in this report). This provides a denser time sampling for each region on the sky for part of the survey duration, at the cost less dense sampling during the rest of the survey. [p 6]
A subsection (7.8) is devoted to rolling cadences. It describes them as follows:
Rolling cadences allow different time sampling over limited area and over limited time. They are motivated by trying to yield better SN light curves, variable star light curves and transient sampling. [p 23]
The topic is also covered in the 2017 (but, I believe, “living”) arXiv report on LSST observing strategies: [1708.04058] Science-Driven Optimization of the LSST Observing Strategy. Section 25 (by Stephen Ridgway) is devoted to rolling cadences. It begins as follows:
With a total of ~800 visits spaced approximately uniformly over 10 years, and distributed among 6 filters, it is not clear that LSST can offer the sufficiently dense sampling in time for study of transients with typical durations less than or ~1 week. This is particularly a concern for key science requiring well-sampled SNIa light curves. “Rolling” cadences stand out as a general solution that can potentially enhance sampling rates by 2× or more, on some of the sky all of the time and all of the sky some of the time, while maintaining a sufficient uniformity for survey objectives that require it.
Several pages are devoted to describing rolling cadence options and constraints. There’s a nice, short sub-subsection, 2.5.2, on “Rolling Cadence Basics”:
Assume a fixed number of observing epochs for each point on the sky, nominally distributed uniformly over the 10-year survey duration. A subset of these can be reallocated to provide improved sampling of a given sky region in a given time interval. This will have the inevitable effects of: (1) reducing the number of epochs available for that sky region during the rest of the survey (affecting, for example, proper motion studies), and (2) displace observations of other sky regions during the time of the improved temporal sampling (affecting, for example, early large scale structure studies needing high depth uniformity). In short, the cadence outside the enhanced interval will be degraded.
The essential parameters of rolling cadence are: (1) the number of samples taken from the uniform cadence, and (2) the enhancement factor for the observing rate.
For more details, it points to an LSST Project document that I haven’t yet read in detail, "A Rolling Cadence Strategy for the Operations Simulator, " by Kem Cook & Stephen Ridgway: OpSim Rolling Cadence Stratgey-ver1.3. That might be the definitive early document; it’s from April 2014, predating the NOAO/LSST workshop. It includes a 1-line definition:
Rolling cadence – a visit sequence that is applied to each part of the sky, but for only part of the survey
It then goes on to describe motivations and constraints, and to provide several rolling cadence options. It appears that, at that time, the term was used for a strategy that would be applied across the whole sky. My understanding is that the term is now used more generally. The term makes a bit more sense to me when considered as applying to the whole sky, in the sense that periods of dense and sparse coverage roll across the whole sky.
If there is ever a definitive definition, it should probably be added to the LSST Corp Astro Glossary: Astro Glossary - LSST Software User Guide - Confluence. It currently defines “cadence”:
Cadence: The sequence of pointings, visit exposures, and exposure durations performed over the course of a survey.
But it does not have an entry for “rolling cadence.” My own capsule summary might combine material from a few of the above quotes:
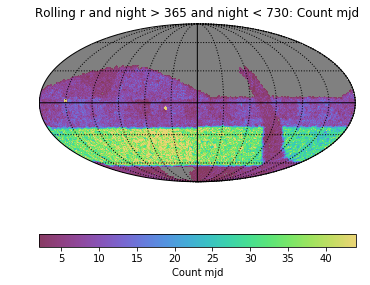
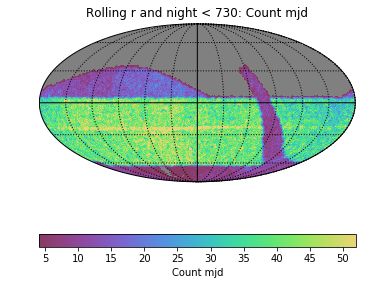
Rolling cadences adjust the time sampling over specified areas, reallocating samples that would nominally be distributed approximately uniformly over the survey duration so that the sampling is denser in some periods and sparser in others. Periods of dense sampling must move (roll) over the sky. Rolling cadences are motivated by trying to yield better sampling of classes of variable and transient objects. Key parameters of a rolling cadence include: (1) the areas affected; (2) the number of samples taken from the uniform cadence; and (3) the enhancement factor for the observing rate. The latter parameters may be filter-dependent.
But every time I read that I want to change something!
-Tom
