I’m am trying to run “step1”, which I believe is analogous to Gen2’s processCcd.py on a set of ~250 raw DECam exposures using pipeline version v23_0_1. The specific command I ran is:
DATAQUERY=“exposure.observation_type=‘science’ AND detector!=2 AND detector!=61”
OUTPUT=DECam/runs/v01
LOGFILE=$LOGDIR/step1-v01.log; \
date | tee $LOGFILE; \
pipetask --long-log run --register-dataset-types -j 20 \
-b $REPO --instrument lsst.obs.decam.DarkEnergyCamera\
-i $INPUT \
-o $OUTPUT\
-C calibrate:config/processCcd_grz_config.py \
-C transformPreSourceTable:config/transformPreSourceTable_config.py \
-c calibrate:deblend.maxFootprintArea=3000\
-c characterizeImage:psfIterations=1 \
-c characterizeImage:measurePsf.psfDeterminer.name=“psfex” \
-c calibrate:astrometry.matcher.maxRefObjects=3000 \
-c isr:doFringe=False \
-p $DRP_PIPE_DIR/pipelines/DECam/DRP-Merian.yaml#step1 \
-d “instrument=‘DECam’ AND $DATAQUERY” \
2>&1 | tee -a $LOGFILE; \
date | tee -a $LOGFILE
At the very start of the log file, I get a printout that says:
Mon Nov 14 23:49:03 MST 2022
Then for the next~4.5 hours after that, the pipeline appears to be constructing the QuantumGraph, until I get the following printout.
INFO 2022-11-15T04:15:00.576-07:00 ctrl.mpexec.cmdLineFwk ()(cmdLineFwk.py:580) - QuantumGraph contains 71100 quanta for 5 tasks, graph ID: ‘1668510854.4324667-23353’
During the several hours when the QuantumGraph is being created, I see just one Python process running at ~100% CPU, even though my command includes -j 20 for 20x parallelism. Is there something about the nature of QuantumGraph’s such that it isn’t possible for a large one to be created in a parallelized manner? Using the 20 CPU’s requested would seem to me like it has the potential to speed this up considerably.
Is the ~4.5 hour time to create the QuantumGraph expected? This seems like a long time to me, but I guess I don’t know what to expect. For comparison, the actual processing of ~14k+ DECam CCD’s after QuantumGraph creation took ~30 hours. So the 4.5 hours isn’t a negligible perturbation on top of the actual reductions.
I am running this on our group’s small/local linux server with 40 CPU’s. Other than the above command that I ran, there was no other compute load on the system while I ran this test.
Graph building is almost entirely a big database query. It is not parallelizable via -j to my knowledge. If you were using a SQLite database as in the other topic, this could definitely be slow. It’s possible a PostgreSQL database implementation might speed things up.
Yes, I’m just using SQLite, as I believe that’s the default. I guess the reason I thought there was a chance for parallelizing graph creation to be effective is that, in my specific case here, everything is embarrassingly parallel by DECam CCD.
I see there’s a pipetask qgraph. Is there any chance that parallelizing with N separate pipetask qgraph calls split out manually by dataID (e.g., exposure or detector number) via -d would result in N times speed-up? Or would that just result in very slow database operations for every separate thread trying to use the database?
Again, I’m hoping to scale up to tens of thousands of DECam exposures (most I’ve done so far is 7k but that was with Gen2), in which case the 4.5 hours here would translate into roughly 1+ week per 10k exposures.
I realized that the final sentence in my previous statement assumed that the time taken to initially create the QuantumGraph in serial would scale linearly with the number of exposures/quanta.
To see whether this is indeed the case, I tried an experiment using a set of 260 DECam exposures, and then half of that set of 260 by restricting the exposure number using -d:
DATAQUERY="exposure.observation_type='science' AND detector!=2 AND detector!=61 AND exposure<=430399"
OUTPUT=DECam/runs/v00-half
LOGFILE=$LOGDIR/step1-v00-half.log; \
date | tee $LOGFILE; \
pipetask --long-log run --register-dataset-types -j 20 \
-b $REPO --instrument lsst.obs.decam.DarkEnergyCamera \
-i $INPUT \
-o $OUTPUT \
-C calibrate:config/processCcd_grz_config.py \
-C transformPreSourceTable:config/transformPreSourceTable_config.py \
-c calibrate:deblend.maxFootprintArea=3000 \
-c characterizeImage:psfIterations=1 \
-c characterizeImage:measurePsf.psfDeterminer.name="psfex" \
-c calibrate:astrometry.matcher.maxRefObjects=3000 \
-c isr:doFringe=False \
-p $DRP_PIPE_DIR/pipelines/DECam/DRP-Merian.yaml#step1 \
-d "instrument='DECam' AND $DATAQUERY" \
2>&1 | tee -a $LOGFILE; \
date | tee -a $LOGFILE
The scaling is indeed pretty close to linear (~136 minutes for 130 exposures = 39000 quanta versus ~258 minutes for 260 exposures = 78000 quanta).
head step1-v00.log |grep -i 2022 |grep -v WARN
Sun Nov 20 08:06:43 MST 2022
INFO 2022-11-20T12:24:11.173-07:00 ctrl.mpexec.cmdLineFwk
()(cmdLineFwk.py:580) - QuantumGraph contains 78000 quanta for 5
tasks, graph ID: ‘1668972199.282599-136252’
head step1-v00-half.log |grep -i 2022 |grep -v WARN
Sun Nov 20 23:47:29 MST 2022
INFO 2022-11-21T02:03:12.573-07:00 ctrl.mpexec.cmdLineFwk
()(cmdLineFwk.py:580) - QuantumGraph contains 39000 quanta for 5
tasks, graph ID: ‘1669021366.2601583-58103’
I ran a test of “step1” with ~70k quanta on the Rubin Science Platform with pipeline version v23_0_2, and the time taken to initially build the QuantumGraph in this case was longer, right about 9.5 hours for 71.1k quanta. This is still using a SQLite database. I will look into whether PostgreSQL gives better performance.
DATAQUERY="exposure.observation_type='science' AND detector!=2 AND detector!=61"
OUTPUT=DECam/runs/v01
LOGFILE=$LOGDIR/step1-v01.log; \
date | tee $LOGFILE; \
pipetask --long-log run --register-dataset-types -j 4 \
-b $REPO --instrument lsst.obs.decam.DarkEnergyCamera \
-i $INPUT \
-o $OUTPUT \
-C calibrate:config/processCcd_grz_config.py \
-C transformPreSourceTable:config/transformPreSourceTable_config.py \
-c calibrate:deblend.maxFootprintArea=3000 \
-c characterizeImage:psfIterations=1 \
-c characterizeImage:measurePsf.psfDeterminer.name="psfex" \
-c calibrate:astrometry.matcher.maxRefObjects=3000 \
-c isr:doFringe=False \
-p $DRP_PIPE_DIR/pipelines/DECam/DRP-Merian.yaml#step1 \
-d "instrument='DECam' AND $DATAQUERY" \
2>&1 | tee -a $LOGFILE; \
date | tee -a $LOGFILE
[ameisner@nb-ameisner logdir]$ head -1 step1-v01.log
Sun Nov 27 08:33:08 UTC 2022
[ameisner@nb-ameisner logdir]$ head step1-v01.log |grep -i quant
INFO 2022-11-27T18:04:28.152+00:00 ctrl.mpexec.cmdLineFwk ()(cmdLineFwk.py:580) - QuantumGraph contains 71100 quanta for 5 tasks, graph ID: ‘1669572228.0541391-23246’
QuantumGraph generation being slow is definitely a known issue, but the efforts to fix it are for the most part big projects that won’t come to fruition for a while.
The worst performance scenario is more or less the one @ktl already described, in which we’re limited by the performance of a single large database query that kicks things off. Ideally that one would be O(N log N) where N is something more like the number of edges in the graph than the vertices (e.g. if the graph has both visits and skymap patches, it will scale with the number of visit-patch overlaps, not just the number of visits or the number of patches). It usually it is, though those large queries can still take a very long time; the catastrophically bad performance occurs when the database doesn’t use the right indexes and the scaling is O(N^2) or worse. My guess is that’s not what’s happening here, and you’re just on the high side of what we consider normal scaling.
In addition to that big initial query, there are two places where QuantumGraph generation tends to spend its time:
There’s post-query Python code that processes the results of that big query row-by-row; this should be O(N) in that “number of edges” factor. For step1, that should be pretty similar to the total size of the graph, since there are no spatial joins other than the reference catalog lookups.
There are additional follow-up queries for “prerequisite” datasets like calibration products and reference catalogs, which are performed per quantum. While each of these is super fast, in aggregate they can be slow when the pipeline has a lot of those datasets, as step1 does. While I haven’t looked carefully, my recollection is that DECam step1 is particularly bad in this sense due to the need for inter-CCD crosstalk correction.
So my best guess is that it’s mostly those follow-up queries slowing you down in this case, and if that’s true, putting that SQLite database on fast local disk is probably the best bet for a speedup. And it may well be that it’s the time to acquire filesystem locks or open files is more important than raw I/O performance; there’s relatively little I/O happening, but each query has to make sure it’s transactionally safe and those overheads can be pretty huge.
If you want to test that theory yourself, you can run pipetask with
It may be that we’ll see something unexpected that’s easy to fix. The calibration lookup problem is not easy to fix, and it’s been around a long time, but it is something I’m actively working on (at least in the sense of addressing blockers for fixing the real problem).
Thanks, @jbosch ! I really appreciate all those details. In my earlier post in this thread, I found empirically that the scaling in my specific case is quite nearly linear with N (the number of quanta).
Also, this 71.1k quanta example was indeed faster on a small server’s local file system (~4.5 hours) versus on the RSP (~9.5 hours).
Thanks a lot for the suggested command. I’m now running the following command (on my group’s local server/filesystem) and will post the output log file when the process completes:
I see that I accidentally did a couple of strange things in my command, specifying -o twice and giving the first -o argument as if it were a log file, not the actual output file. Anyway, I’ve attached the resulting <output_file> file. Time to generate the QuantumGraph was again in the 4.5 hour range, maybe a little longer, fairly consistent with previous performance on this machine/filesystem. Thanks again! qgraph_test.log (2.8 MB)
My DATAQUERY excludes 2 specific CCD’s per exposure, so maybe that’s where the "- (2 * N_exposures) " comes in, for the crosstalk between CCDNUM = 2 and CCDNUM = 61 (and vice versa).
@ktl We tried constructing this same QuantumGraph with a PostgreSQL Butler rather than the default SQLite.
It took only ~9 minutes to construct the QuantumGraph with the PostgreSQL Butler!
$ head -1 step1-v01.log
Tue Dec 6 18:38:18 MST 2022
$ head step1-v01.log |grep -i quant
INFO 2022-12-06T18:47:34.610-07:00 ctrl.mpexec.cmdLineFwk ()(cmdLineFwk.py:580) - QuantumGraph contains 71100 quanta for 5 tasks, graph ID: '1670377605.4779458-12940'
Here’s the exact same thing but with an SQLite Butler:
$ head -1 step1-v01.log
Mon Nov 14 23:49:03 MST 2022
$ head step1-v01.log |grep -i quant
INFO 2022-11-15T04:15:00.576-07:00 ctrl.mpexec.cmdLineFwk ()(cmdLineFwk.py:580) - QuantumGraph contains 71100 quanta for 5 tasks, graph ID: '1668510854.4324667-23353'
So it’s a difference of 266 minutes (SQLite) versus 9 minutes (PostgreSQL), a factor of ~30x improvement. Are there any further PostgreSQL configurations/parameters we should look into optimizing for potential additional speedup? Thanks!
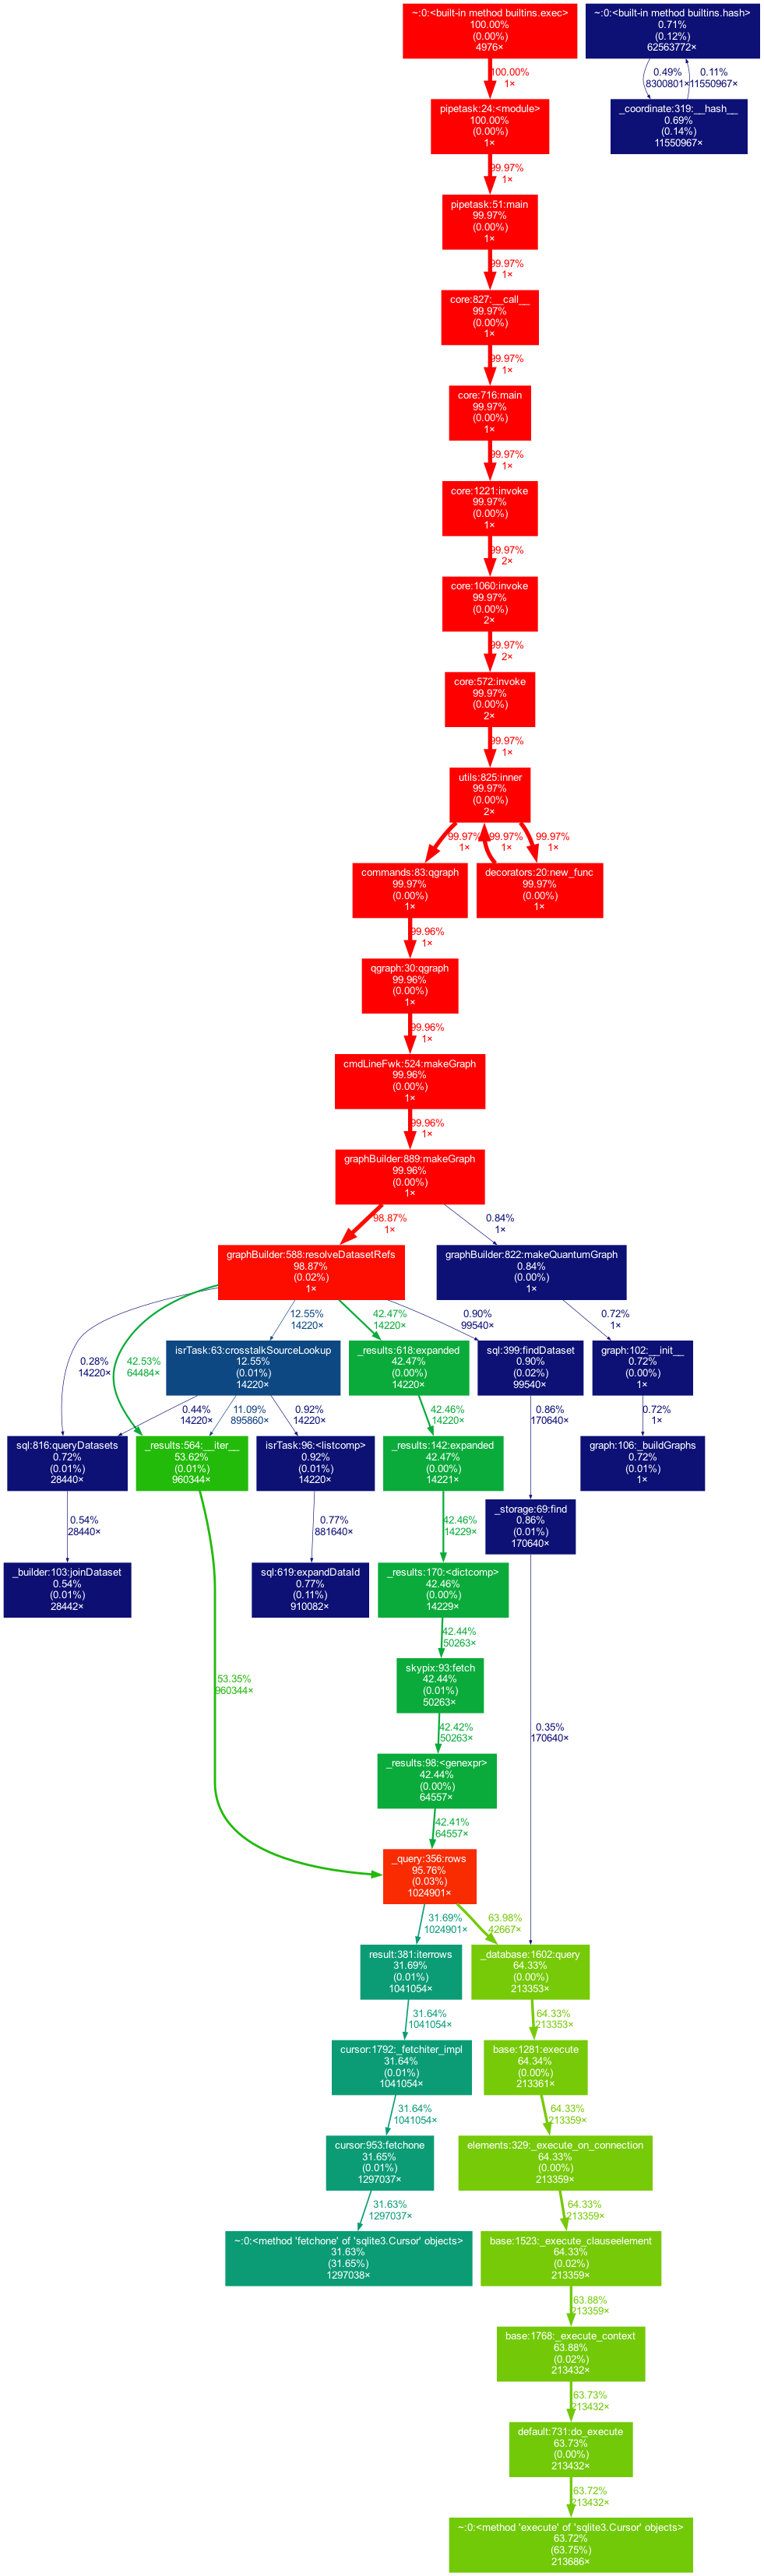
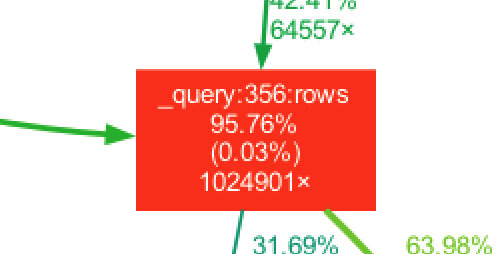
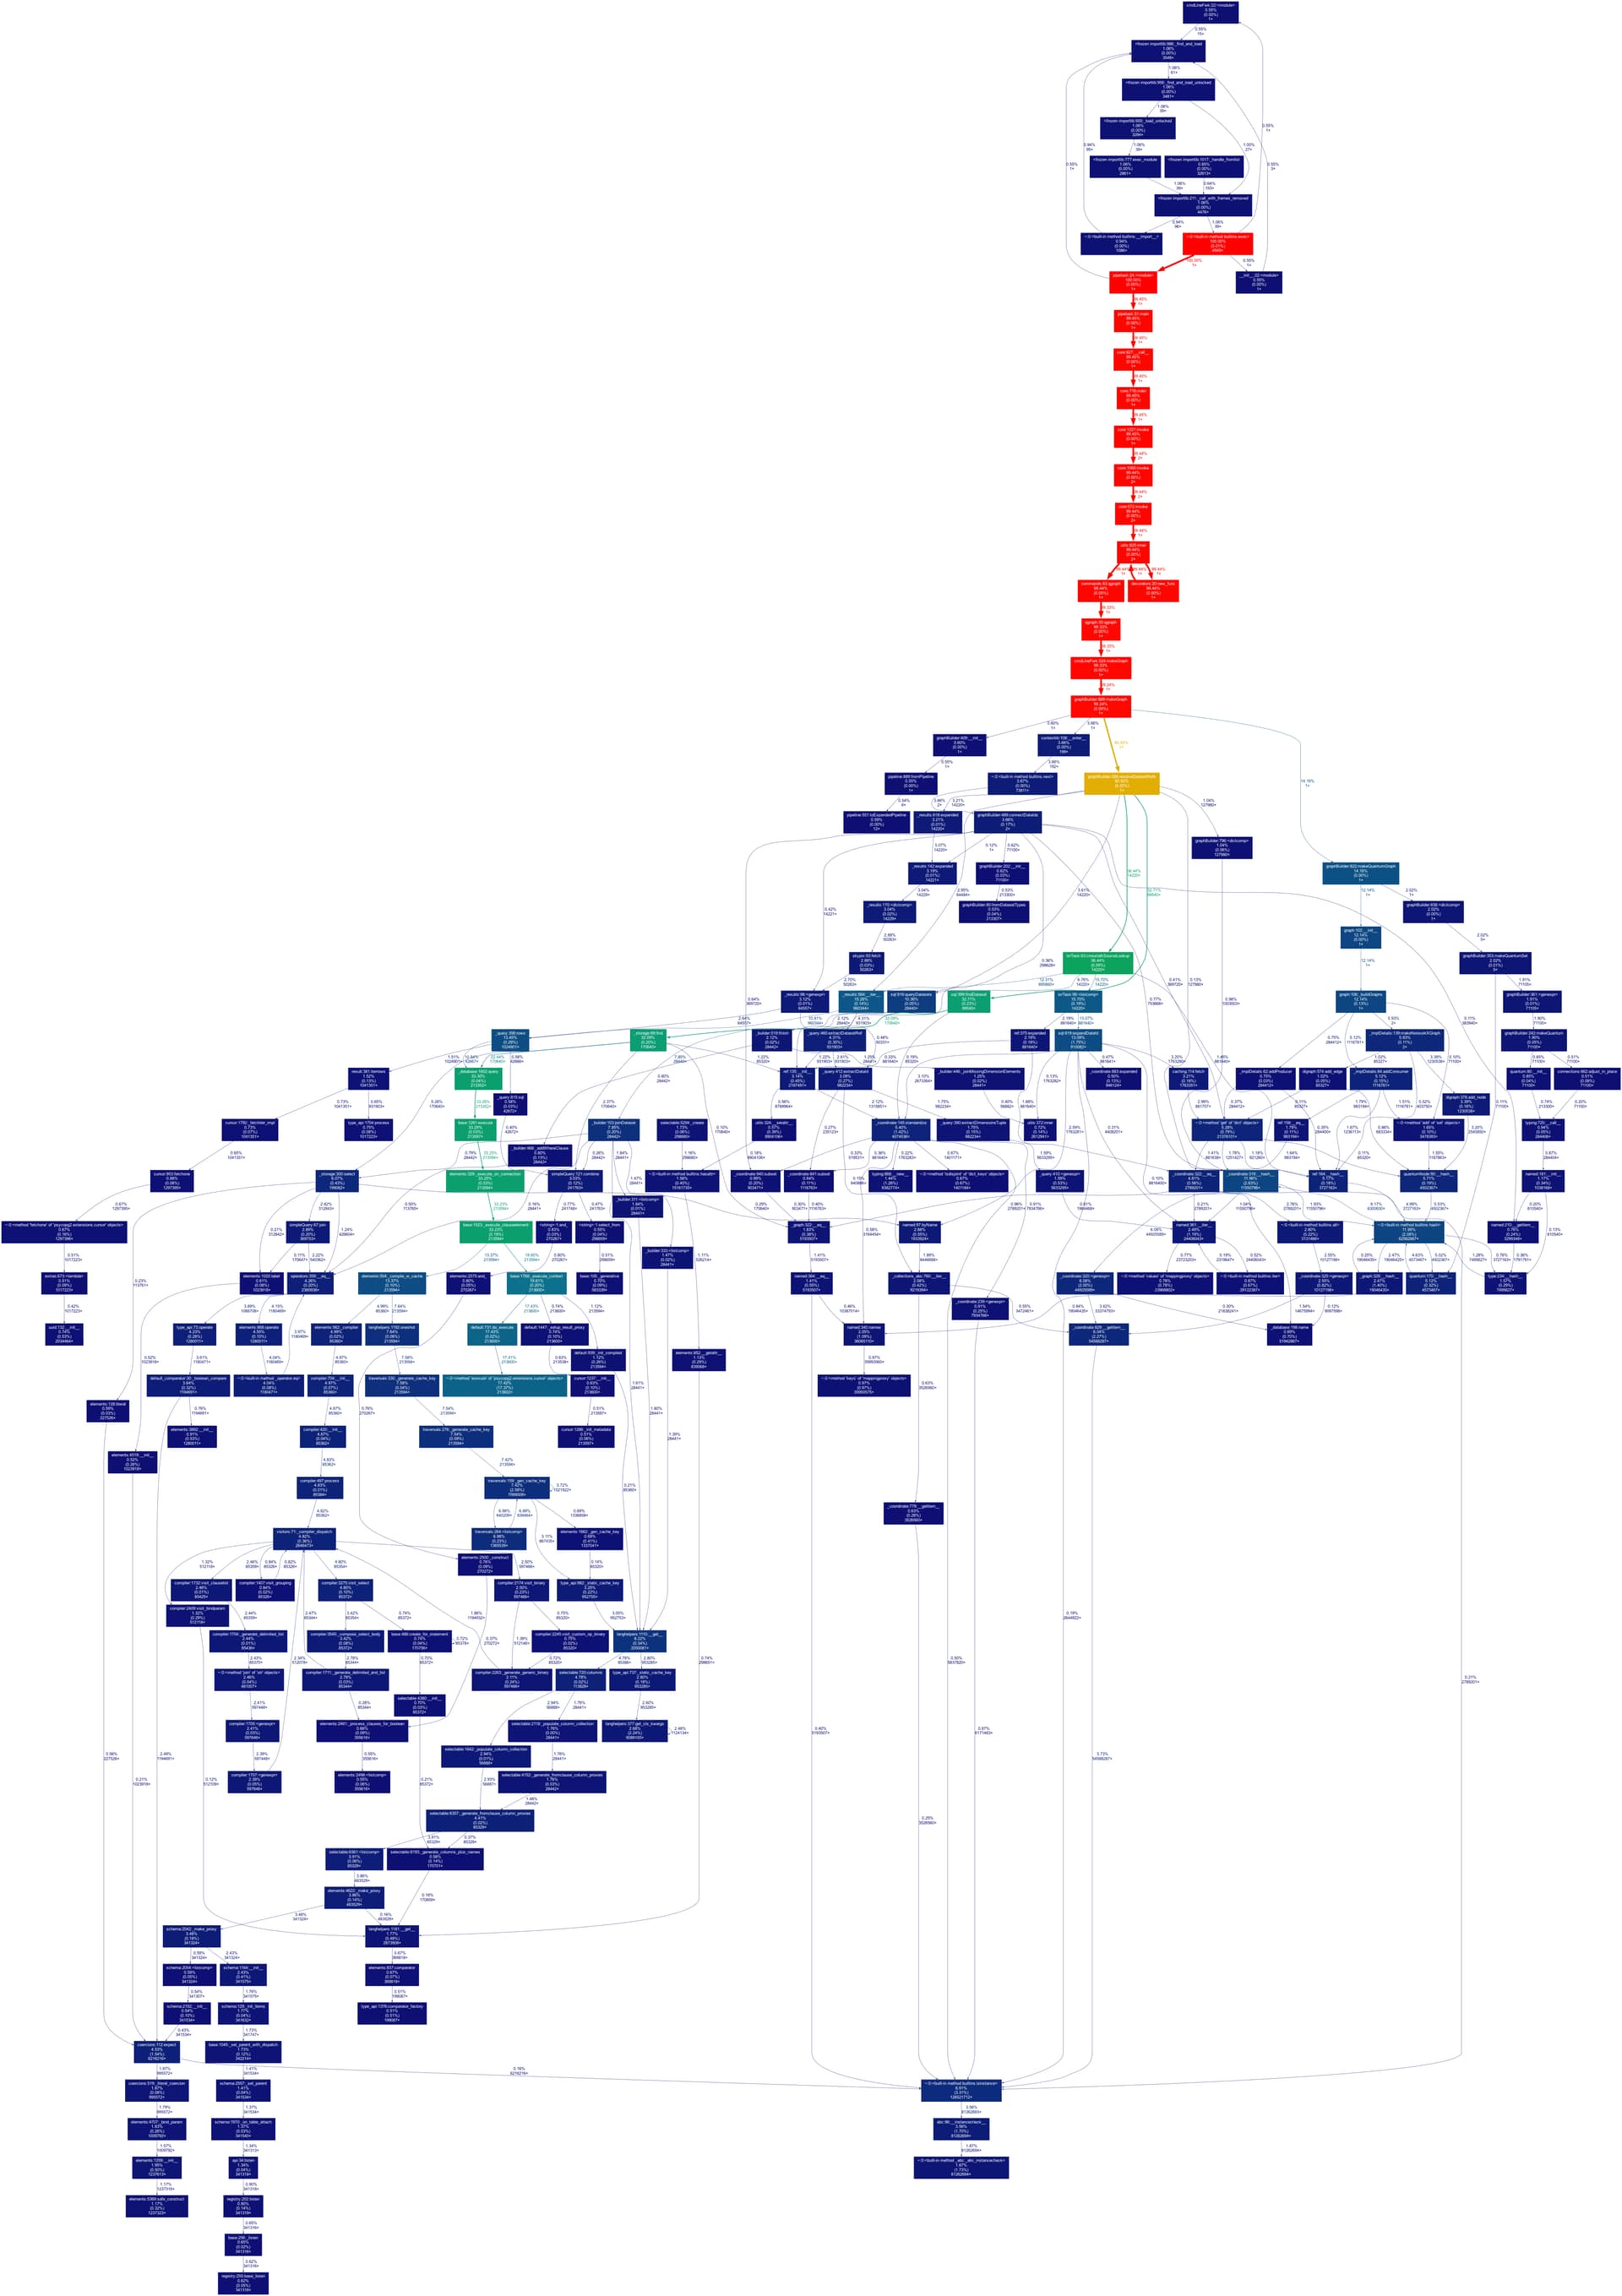
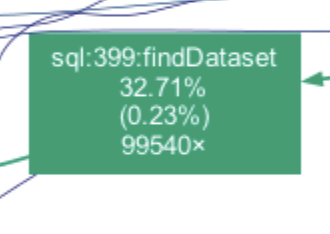
I’m attaching the updated cProfile visualization (again made by Destry) for the case of running the step1 QuantumGraph creation using a PostgreSQL Butler:
Based on your talk this morning I just realized you are doing all this on v23.0. That version is from October 2021 so is not representative of the current state of the software. I’m sure graph-building is still slow but now that you are deep-diving into things it would help a lot if you were using a much newer software version (either the current weekly or at least w.2022.48 which will become v25) so that your reports can more easily be related to what we are looking at.
Sorry, I still haven’t tried w.2022.48. I will try moving to w.2022.48 as my next step. But I did already get some very encouraging results with v24_0_0 for building my QuantumGraph that has ~70k quanta. The same graph that took > 10 hours to build with v23_0_2 on RSP took only 8.5 minutes to build on RSP with v24_0_0. In both cases I used an SQLite Butler, launched an identical command (copied below for completeness), and ended up with an identical number of quanta in the resulting graph.
DATAQUERY="exposure.observation_type='science' AND detector!=2 AND detector!=61"
LOGFILE=$LOGDIR/qgraph_test-piff.log

date | tee $LOGFILE; \
python $CTRL_MPEXEC_DIR/bin/pipetask qgraph \
-b $REPO --instrument lsst.obs.decam.DarkEnergyCamera \
-i $INPUT \
-C calibrate:config/processCcd_grz_config.py \
-C transformPreSourceTable:config/transformPreSourceTable_config.py \
-c calibrate:deblend.maxFootprintArea=3000 \
-c characterizeImage:psfIterations=1 \
-c calibrate:astrometry.matcher.maxRefObjects=3000 \
-c isr:doFringe=False \
-p $DRP_PIPE_DIR/pipelines/DECam/DRP-Merian.yaml#step1 \
-d "instrument='DECam' AND $DATAQUERY" |tee -a $LOGFILE
date | tee -a $LOGFILE; \
Quick comment, but if you use pipetask --log-file mylog.txt qgraph then it should log everything to a log file. (if you use .json you will get easy to parse log file).