Hi @nsevilla,
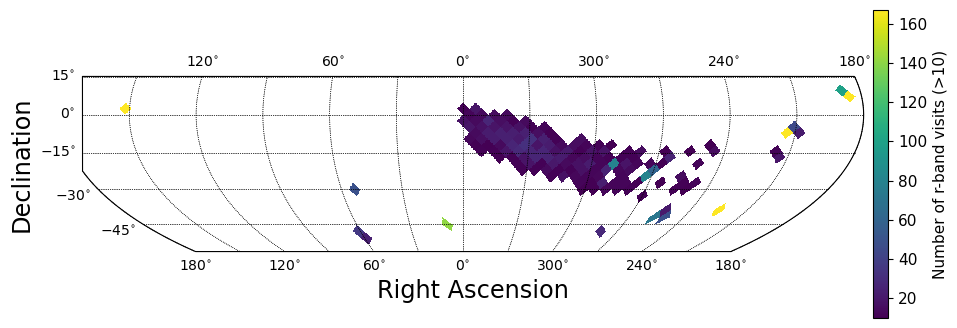
Here is a code example to visualize a healsparse map only for sky positions that have, as an example, 10 or more exposures (visits) in the r-band in Early Data Preview 2. You can replace the minimum number with 3 and use your band of interest. It will run in the RSP at data.lsst.cloud with the recommended image and a large container.
import numpy as np
import matplotlib.pyplot as plt
import skyproj
import hpgeom as hpg
import healsparse as hsp
from lsst.rsp import RSPDiscovery

discovery = RSPDiscovery("dp2")
tap_service = discovery.get_tap_client()

# Query for r-band visits
query = """SELECT visit, ra, dec, band
           FROM dp2.Visit WHERE band='r' """
job = tap_service.submit_job(query)
job.run()
job.wait(phases=['COMPLETED', 'ERROR'])
visit_table = job.fetch_result().to_table()

nside_coverage = 16
nside_sparse = 16
pixels = hpg.angle_to_pixel(nside_sparse, visit_table['ra'], visit_table['dec'],
                            lonlat=True, nest=True)
uniq_pix, counts = np.unique(pixels, return_counts=True)
float_counts = counts.astype(np.float64)
hspmap = hsp.HealSparseMap.make_empty(nside_coverage, nside_sparse,
                                      dtype=np.float64, sentinel=hpg.UNSEEN)

# Restrict map to healpix with >=10 r-band visits
tx = np.where(float_counts >= 10.0)[0]
hspmap.update_values_pix(uniq_pix[tx], float_counts[tx], nest=True)

fig, ax = plt.subplots(figsize=(12, 8))
sp = skyproj.McBrydeSkyproj(ax=plt.gca())
sp.draw_hspmap(hspmap, label="Observation Count")
sp.draw_colorbar(label='Number of r-band visits (>10)', shrink=0.5, pad=0.01)
plt.show()
The above code will create this plot:
As Gloria mentions, “what are the regions of the sky with at least 3 exposures in EDP2” (which this code snippet addresses) is a different question from “what are the regions of the EDP2 deep coadd images to which at least 3 exposures contributed”.
If the latter is the correct interpretation of your question, then yes the exposure time sum map can be used because the survey property maps represent properties of the deep coadd images. In this case I’d recommend working through the DP2 tutorial notebook 202.1. Deep coadd images, especially the second figure in Section 4.1.1. which shows the number of inputs per cell of a deep coadd patch. Then also work through 203.1. Survey property maps.
If this answers your question can you mark this reply post as the solution? And if not, let us know and we can keep working.