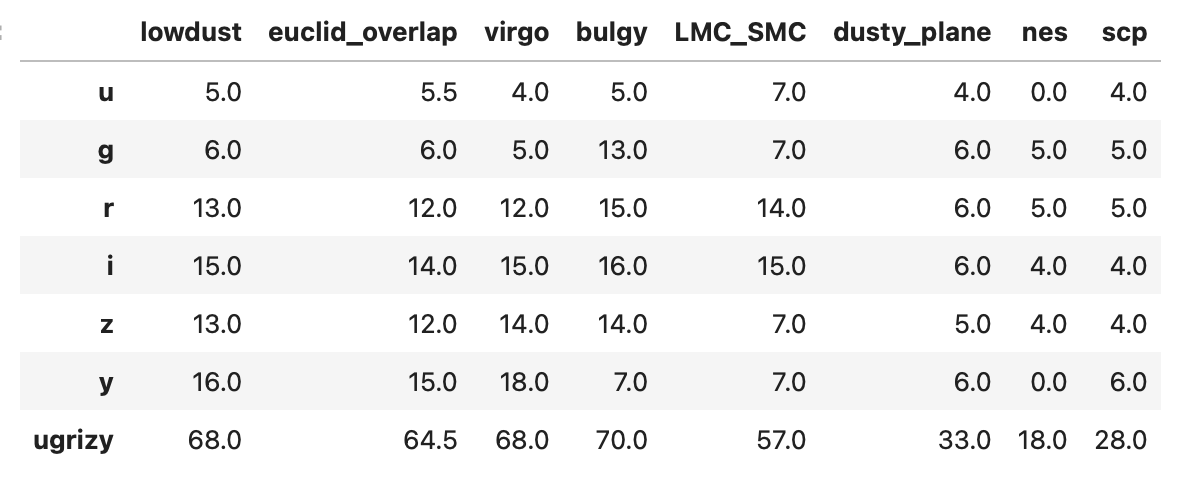
I’ve been getting questions about expectations for how much data will taken per field in Year 1 split per filter for observing proposals. This information is easy to extract if you know how to get the rubin_sim simulations output , but less so if you’re not that into the know on the rubin cadence and instead been referring to the survey strategy website. Is it possible to show some plots/place a table of the median/average number of observations per filter in each portion of the LSST footprint in the survey strategy website or reply with those numbers here for v5.0 footprint?
We think v5.0 is likely not really very accurate at this point, however we do not have an updated baseline ready to share with the community yet.
So - I will use v5.0 to show information about Y1, as requested. I’ll reply here.
Note that v5.0 did include additional downtime in Y1 compared to later years, which means it’s closer to current expectations in Y1, but is still somewhat optimistic. v5.0 contains 2 weeks of planned downtime, for example, compared to current expectations being closer to 5.5 weeks of planned downtime. The unscheduled downtime is proving harder to wrangle, as this is where there is currently being a much wider range than expected – both sometimes being quite good, and then sometimes being rather terrible. The current TMA performance is slower than we simulated in v5.0, but this seems likely to converge within a few months, so is not my major concern at present.
A major difference we are currently trying to understand the impact of (and to create meaningful simulations of) is how to prioritize template gathering in Y1. One impact here is that we will need to obtain more u and g band images in Y1 compared to later years, as template requirements are more strict than our initial (too optimistic) expectations (essentially shifting the survey balance a bit bluer in Y1). Thus the details of the simulation/configuration itself are likely to change compared to v5.0.
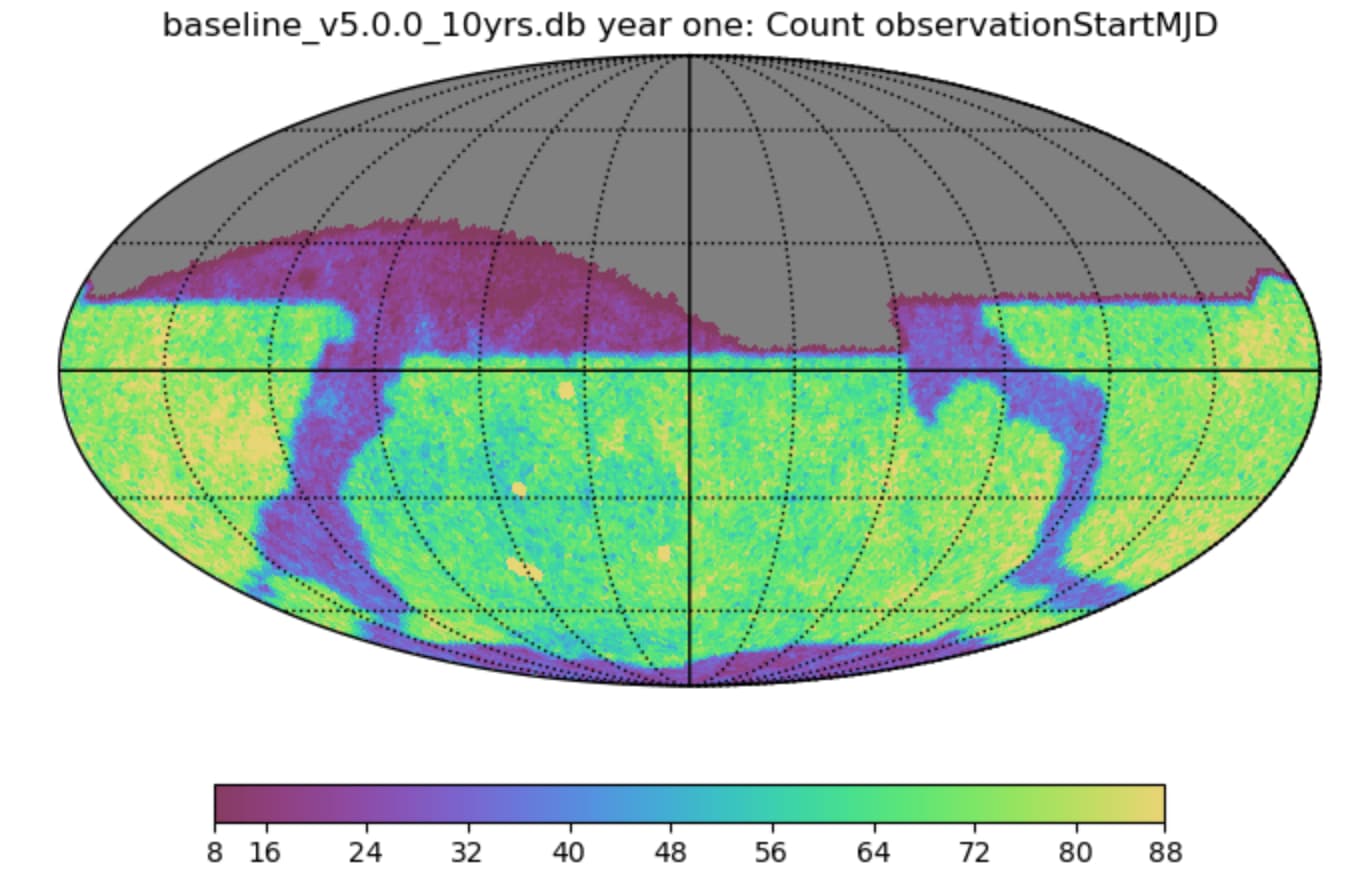
First an all-sky plot of all visits obtained in year one, in v5.0.
Since we now believe that we need closer to 6 visits per band per point on the sky in order to make templates, it’s clear that we need to attempt some rebalancing of this strategy in year one and consider extending the time period to collect visits for template generation at least slightly beyond the end of year one.
We’re working with the Prompt Processing team to better understand the minimum requirements for template creation, so that we can understand what changes are necessary.
Going from 3–>6 is a big jump. So are you saying that the Solar System community would have to wait until data release 2 to have image subtraction in the NES?
I would not expect so – although perhaps we’re also labelling things differently … as you know “DR1” is now the data release after year one, so DR2 would be the data release after year 2.
As I said above, we’re looking at how to change the survey strategy to acquire the necessary visits by the end of year one, but also we’re looking at what happens if we do not have complete sky coverage and how long it would be until that occurs (and template can be built).
There is also the ongoing question of incremental template generation, and what that means. I think given that more visits are necessary what you’ll see if that we will not be able to do much incremental template generation within the first season that a field is available (in the bluer bands like u/g at least … perhaps still an open question for redder bands), but that doesn’t mean that you’d have to wait until after the data release is fully processed and available in order to have templates available for the start of the next season.
The prompt processing team are investigating these questions, as well as the minimum requirements in terms of acquired images.
Making them after the season is over kinda defeats the purpose of an incremental template. The idea is to be able to try to identify some transient sources during the observing season via image differencing. Is there a reason not to make templates first with whatever is available (say 3 or 4 observations) so at least part of a given pointing has image subtraction running and then when there are enough to satisfactorily make a more complete template then the template is regenerated?
I think many options remain on the table. As soon as a set of images reaches the sufficient completeness, depth, and quality to make a template they will be used and the template will be made and the plan to build incremental templates has not changed. But we expect that that number will generally be greater than 3, and likely >=6. As part of that we are also considering different completeness thresholds (on the footprint overall and locally as a template is made).
It’s worth noting also that RTN-011, Section 4.1 already states: “Scientifically it is important that once a template is constructed for a given region of sky, it is used exclusively until it can be updated in the next Data Release. Repeated changes to the template make it extremely difficult to construct usable lightcurves…”. In addition, even if template generation occurs after a season ends, this still happens before DR1, whose timeline is relatively long.