Ap_pipe in sequential

Hi all,

As explained in this post, I am running ap_pipe on HSC public data to produce light curves, using v20.0.0 and gen2.
I was having issues running it in //, where I had doublets as is also seen here*, as well as other issues like :

InternalError: (psycopg2.errors.InternalError_) right sibling's left-link
doesn't match: block 20306 links to 44760 instead of expected 44023 in index
"PK_DiaSource". 

I then decided to run the job in fully sequential mode. This is challenging at CC, since there are no queues to do // computing on a machine with many cores. Instead there are // queues that use MPI, but as far as I understand, ap_pipe can only use python multithreading (with the option -j), but not MPI, as explained here. So in the end I tried to use 16 cores on a single machine on CC, which crashed due to memory limits. I don’t know what can be taking so much memory, and this is something I already mentioned here.
So I am now using 8 cores.

With this configuration, I don’t have any duplicates issue.
I still have RuntimeErrors which completely skip the given ccd, so no sources/objects are added to the db for these.
I had the same failure for the same visits and ccds in my // run. The different errors are:
RuntimeError: Cannot find any objects suitable for KernelCandidacy
RuntimeError: No coadd PhotoCalib found!
RuntimeError: No matches to use for photocal
RuntimeError: Database query failed; did you call make_apdb.py first?
This last error happened to ccds that had worked in my previous // run, so it might be due to some glitch on the server? My job didn’t crash though, and it worked again for the following visits.
Which brings me to my first question:
If I want to run these failed visit/ccd cases again, I will break the “chronology” since I have objects that might have been generated by later visits, to which sources of these earlier visits might be associated. I don’t think this is an issue for my project of generating light curves, but is there any way to fix this, i.e. insert earlier visits that would redefine object ids, re-index etc?

But except for these issues, this is now running ok, without hanging, and without mess in the db. But my main issue is that it is really slow.
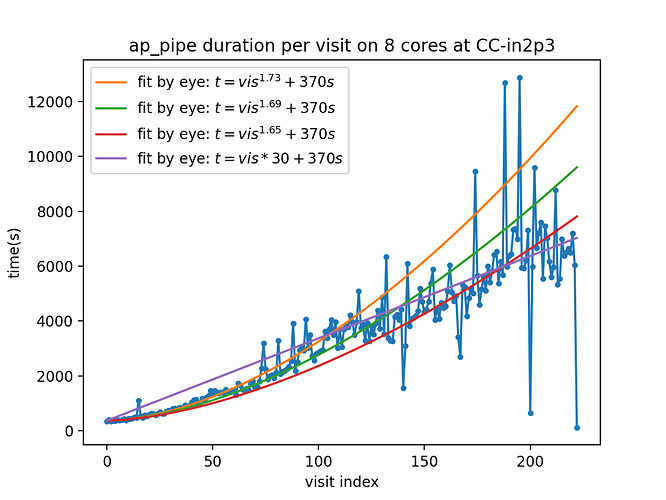
In the figure below, I show the duration of the runs as a function of visit index. I did a few fits by eye in the beginning, which turned out to be quite bad as run went on, but I leave them on the plot.
The few “fast” outliers are jobs that were killed by time limit of my jobs, and restarted, the last one is “in progress”. They currently take about 2h per visit. This is very slow.

Do you know if anyone benchmarked ap_pipe and knows how the time/memory is spent? Association itself should really not take that long, and now, I don’t think there is any weird database access slowdown… Could it be the forced photometry, where I guess it needs to re-access the actual image? I guess it is here updating the forced photometry at every step, whereas I imagine that it only matters at the end, when we have all the sources and a better determined object position…
Is there a way to turn off forced photometry, and only do it in a “post-processing”, or for the last visit?
(Or maybe I miss-understand how forced photometry is done in ap_pipe).

One solution that was suggested by the CC-IN2P3 support, is to use “UNLOGGED TABLES”. I might test this, especially now that I don’t have real clear db issue.

What is the plan in the long term for ap_pipe to deal with the fact that it will get slower and slower as we increase the number of visits? Is it just that for now the code is not fully in place, or that postgresql is not adapted for such datasets?

Sorry for the long post,

Best,

Ben


*though I think my issue was from a different origin: In that DM-26700, the issue was due to a restart of the job after a failure. That happened to me once, but I had duplicates in other situation without job restart, I think due to the fact that I was reading/writting in the database in parallel over the same region of the sky (cosmos).
I cannot answer most of your questions, but I can say that PostgreSQL is known to not scale to even several months’ worth of visits (DMTN-113). We have been investigating Cassandra as a scalable alternative (DMTN-156, DMTN-162, and more coming soon).

1 Like

Hi Ben,

K-T is correct that there are limitations on the DB architecture that are currently being worked through. In addition to that there are parts of DiaPipe that are not fully optimized yet for the larger volume dataset you are running. The pipeline is very much designed for sequential data and running visits out of time order may have some consequences based on how data is loaded and stored in the DB. It may still work, however, it will certainly produce different results than if they had been run in order (perhaps, though, not in a way noticeable or reliant to your analysis.).

The RuntimeError: No coadd PhotoCalib found! error here is likely do to a coadd not existing for the dataset. RuntimeError: Cannot find any objects suitable for KernelCandidacy is a failure of image differencing and is likely a product of a faulty image (it’s saying that it couldn’t find enough stars to compute the convolution for image differencing). RuntimeError: No matches to use for photocal is an error upstream of the association pipeline and again may be due to not many stars detectable in the data. RuntimeError: Database query failed; did you call make_apdb.py first? is currently a catch all error for every database failure, however I do have a ticket to make DB errors report more robust error messages (DM-28555).

As for reducing the processing time: One quick question, is that the time to complete 1 visit with 8 cores or is that the time per ccd?

Removing the DiaForcedSources would require a hack on your part, commenting out lines having to do with them in diaPipe.py. If you are planning on doing your own processing of the lightcurves, you can also play with disabling some of the DiaCalculationPlugins requested by AssociationTask reducing them just to ap_meanPosition and ap_HTMIndex. That should keep the association running but not run any of the lightcurve processing.

1 Like

Hi Chris and K-T,

Thanks a lot for the answers !
This is really helpful.

As for reducing the processing time: One quick question, is that the time to complete 1 visit with 8 cores or is that the time per ccd?

The times I am showing here are for the full visit on 8 cores.
My job at CC is basically a loop to run ap_pipe on every visit, but using --reuse-outputs-from differencer, so only doing the association+forced phot part.
I am then just parsing the log files for each visit and looking for the first and last line of the log, and using their timestamp to calculate the time it took for a single visit. This is ugly but it works…

I might give a try to the hack, but for now I will keep running the vanilla code.

Thanks,

Ben

The quickest thing I can recommend doing from above that is only a change to a config is reducing the number of plugins run for DiaCalculation. If all you care about is the full light curve at the end, I’m guessing you are processing the data at the end rather than relying on the pipeline to redo the calculation every time. I’m not sure how much time you will claw back, but it may be significant.

If it would help, you can get more precise timing information from within Python:

>>> from lsst.daf.persistence import Butler
>>> butler = Butler(<output repository>)
>>> metadata = butler.get('apPipe_metadata', visit=<visit ID>, ccd=<ccd ID>)
>>> # List all tasks that have timing
>>> metadata.names(topLevelOnly=True)
>>> # Specific times
>>> dia_time = metadata.getScalar('apPipe:diaPipe.runEndCpuTime') - metadata.getScalar('apPipe:diaPipe.runStartCpuTime')
16.220889161000002
>>> forced_time = metadata.getScalar('apPipe:diaPipe:diaForcedSource.runEndCpuTime') - metadata.getScalar('apPipe:diaPipe:diaForcedSource.runStartCpuTime')
0.3070306589999916

It’s a bit clumsy, but you can use this to get timing in (almost) as much detail as you like.

Thanks Krzysztof,

apPipe:diaPipe.runEndCpuTime works for me, but metadata.getScalar('apPipe:diaPipe:diaForcedSource.runEndCpuTime') didn’t and I get
KeyError: 'apPipe:diaPipe:diaForcedSource.runEndCpuTime not found'.

I do have lines like:

INFO  2021-02-09T13:30:00.727+0100 apPipe.diaPipe.diaForcedSource.forcedMeasurement ({'visit': 104182, 'ccd': 13, 'filter': 'HSC-Y', 'field': 'SSP_UDEEP_COSMOS', 'dateObs': '2017-02-27', 'pointing': 1884, 'taiObs': '2017-02-27', 'expTime': 300.0})(forcedMeasurement.py:338)- Performing forced measurement on 47578 sources 

in my log file though, so I don’t know why I don’t have this metadata.
Any idea?
(Could it be something that was not added yet in v20.0.0?)

You’re right, timing for DiaForcedSource.run was added after the 20.0 release. It’s available in 21.0.

Setting topLevelOnly=False will tell you the exact keys that are available in your version, but be aware that this is a much longer list; you may wish to filter it before printing.