Hi everyone
I’m attempting to do aperture photometry on some Difference Images that I processed using the pipeline. I’ve seen some references, and it seems that the way to go is to calculate the flux from the source catalog of the Image-Differening data. But I’m not sure how to do this if in some of the images my source is not detected by the pipeline? the one solution that I found is to retrieve the .fits images by exploring the repo directory and measuring the flux using modules like source extractor (python), but again, I know this isn’t very recommendable.
I wonder if there’s a way to obtain the values of an image in their matrix form?
I’m managing the images with butler.get as the following:
I haven’t tried this myself, but it looks like this tutorial includes a step on running forced photometry with the LSST Science Pipelines, in which users can supply the coordinates of the sources they want to measure aperture photometry for.
I’m not sure I would say Source Extractor for aperture photometry isn’t recommended, I’ve used it in the past. Maybe you (or others) would like to expand here on why it wouldn’t work in this case?
Then, regarding your last question of a way to “obtain the values of an image in their matrix form”, where diffexp is an image you have retrived from the Butler, I think you could use
data = diffexp.image
and the result, data, would be a matrix of the image pixel values.
Please do respond to say whether this answers your questions – and if it does, use the checkbox in the options below to mark this reply as the solution, thank you!
Hi Melissa! thank you for your answers I will try your suggestions. With “not recommended” I meant the act of finding the .fits image by exploring the repo directory
Ok So, I tried a few things. I tried running source extractor in diffexp.image, but because the latter is a type: lsst.afw.image.image._imageLib.ImageF, I got a TypeError. I’m not sure how to extract the matrix as a numpy.array.
I checked DiaForcedSourceTask and it looks promising for what I want to achieve :D, from what I read, I must get the DiaObject catalog, as you mentioned.
For that I want to use: Apdb.getDiaObjects, which needs lsst.sphgeom.Region as an input. But I’m not clear about the arguments I have to give to the latter, do you know what I should put as input?
Sorry about that, the matrix of pixel values can be extracted as an array with:
data = diffexp.image.array
I figured this out by first typing data = diffexp.image. and then pressing tab (after the period) to view all options, and I tried .array and it produced an array.
When something is needed as a numpy array I usually use, e.g.,
data = np.asarray( diffexp.image.array, dtype='float' )
Then for your second question about Apdb.getDiaObjects, more information is needed, e.g., it is unclear what Apdb is or what the error message is you’re encountering about lsst.sphgeom.region. It might be best to start a new topic with a more specific title about this new issue, and add more details.
APDB is the Alert Pipeline Database. It is one of the things generated by the Alerts Pipeline. If you are planning to work with difference images, I’d start there.
I agree with most of what Melissa suggested, but wanted to add some more context that might help. First off, absolutely exposure.image.array is what you want for a numpy array with the image data. It may well be simplest for you to use forced photometry techniques you’re already familiar with at this stage, i.e., SourceExtractor, but I wanted to give more info about Rubin Science Pipelines options.
The forced photometry tutorial example Melissa linked to is interesting, but may not be directly applicable for difference image data products, rather it is a task we run on coadds. If you want forced photometry on difference images, it’s a different situation. This presently happens during what we call Data Release Production (DRP) “step 5,” but there is not yet a DECam-specific pipeline for this.
Check out all the various “ingredients” in the drp_pipe package to see what I mean. The LSSTCam-imSim instrument has a defined “step 5” in its instrument-specific DRP.yaml pipeline which is defined in the main DRP.yaml pipeline that it imports. However, the same set of tasks has not yet been written down for or routinely run on DECam data (see DECam’s starter DRP.yaml pipeline). You probably could write your own “step 5” pipeline based on the LSSTCam-imSim example and try running it, provided you are in a situation where all the “step 4” and prior outputs exist. One of those prerequisites is running a DRP-flavored version of association instead of AP association to associate individual detected sources into astrophysical objects.
Separate from your situation, but In general for users of our simulated data preview data products, we’ve been discouraging folks from trying to hack their own forced photometry, because forced photometry tables are one of the data products we will deliver! We absolutely have tools to do forced photometry, but are still working on refining them and sharing the details with users like you in a more accessible and reproducible way. And if all this is overkill for your needs, zero shame in using non-Rubin tools to get the photometry answers you seek
Hello I was wondering if there were any updates regarding the DRP pipe for DECam?
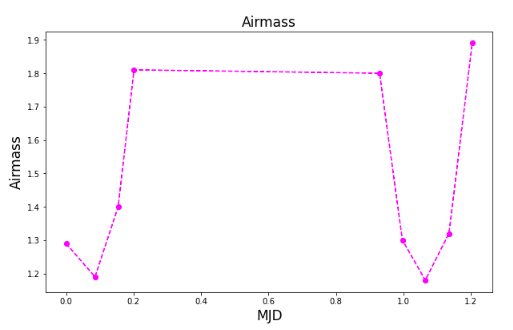
These months I’ve been trying to construct light curves by doing aperture photometry with source extractor on the images produced by the AP pipeline, but even when applying the PhotoCalib method to these images, I have light curves that are similar to the airmass of the observations… meaning that there’s still some calibration that needs to be accounted for:
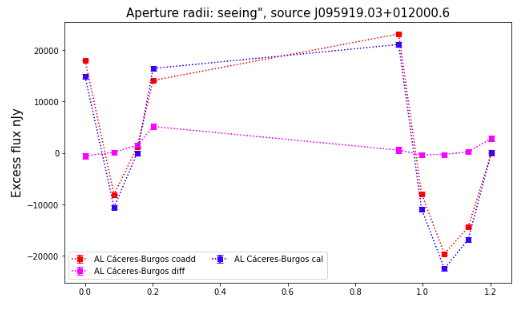
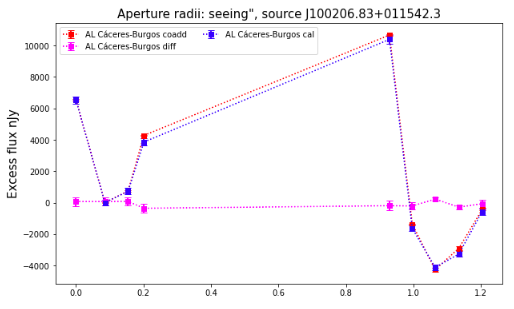
Here is an example of the airmass for a pointing, and two agn sources from different ccds.
the red curve is the matched template, the blue is the science image, and the pink is the difference image.
Both red and blue curve are subtracted by its median flux.

 in the options below to mark this reply as the solution, thank you!