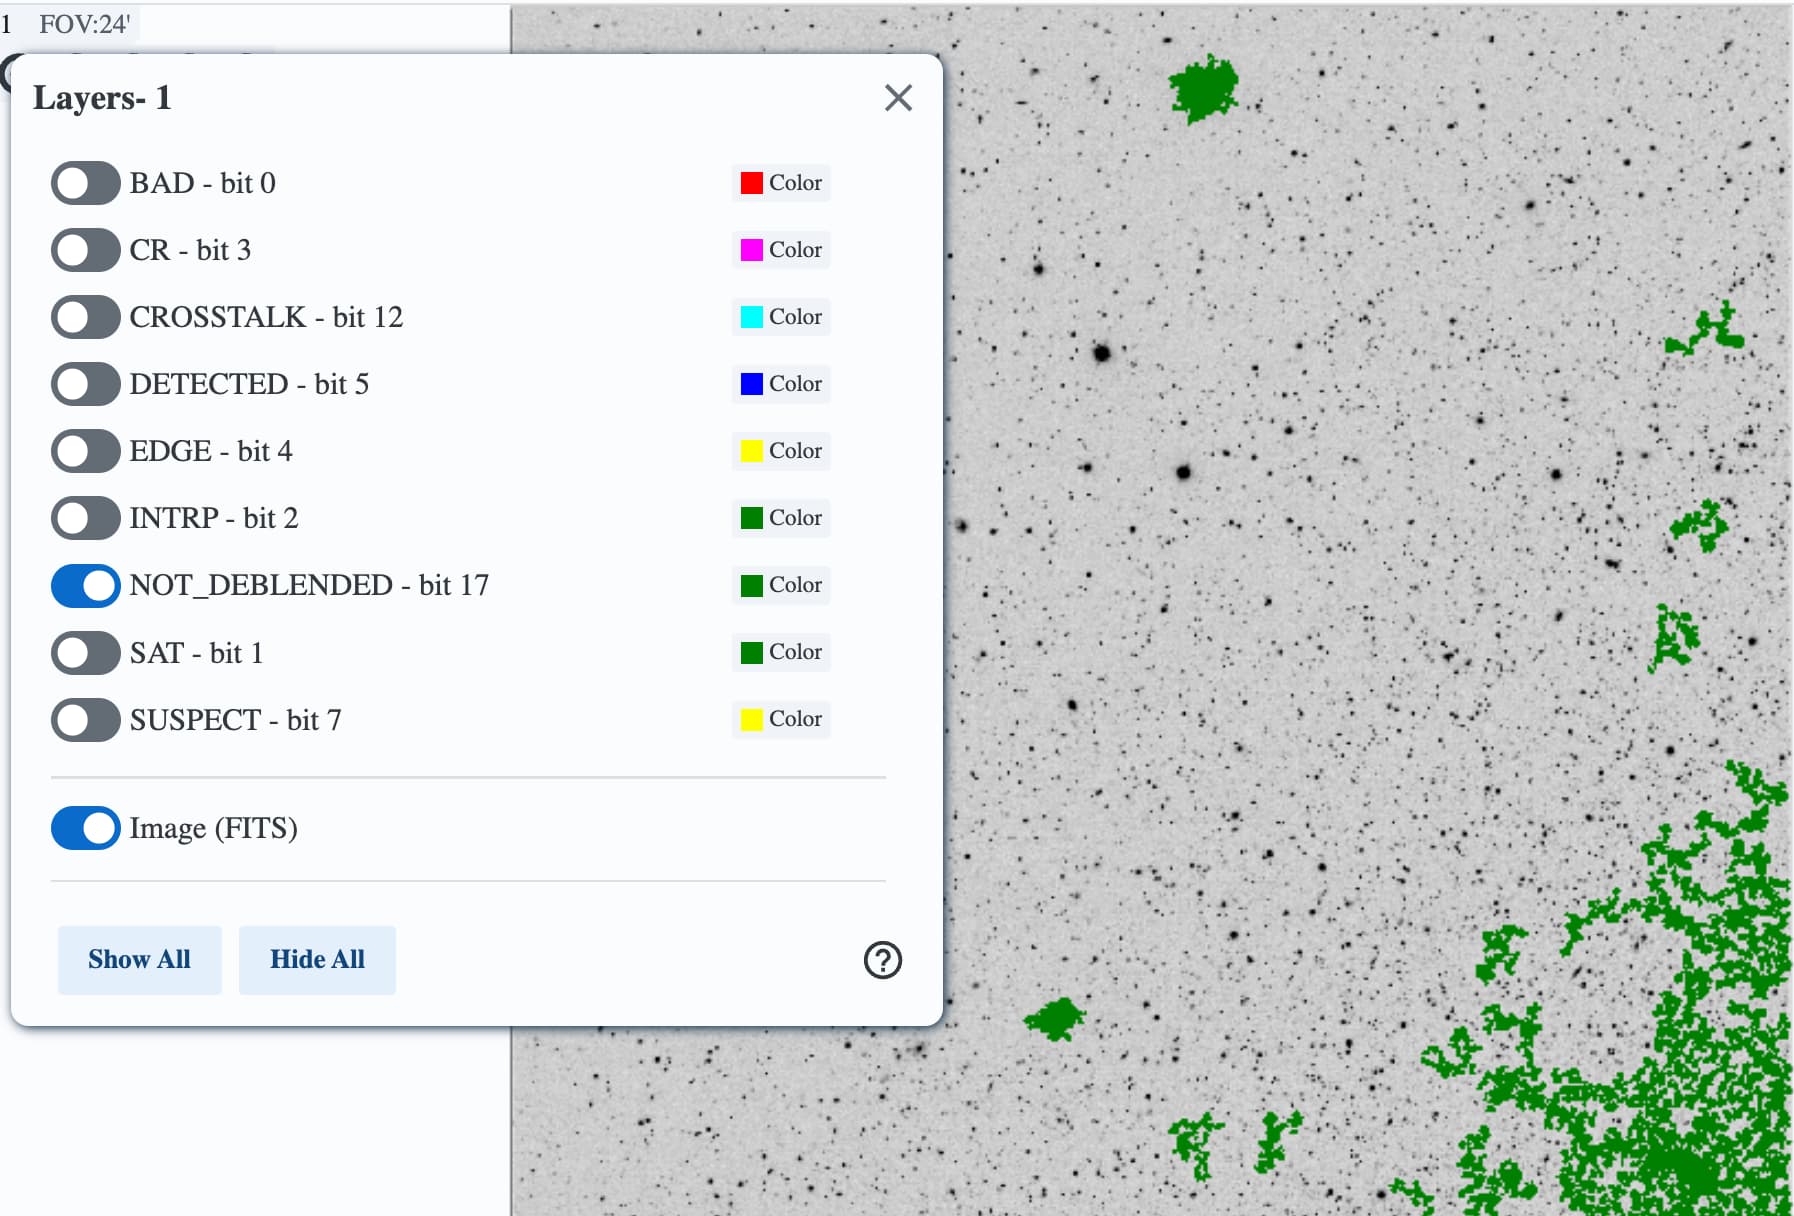
Hello there! My name is Benjamin Unger. I’m a intern at the Space Science Telescope Institute, comparing the photometric pipelines that create catalogs for Rubin images against the photometric pipeline CROWDSOURCE.
I’ve noticed a pattern around places around 47 Tuc and parts of Fornax, where the catalog seems to miss sources in brighter regions. Here is a screenshot of the marked sources at 47 Tuc. (visitId = 2024112400101, detector = 6)
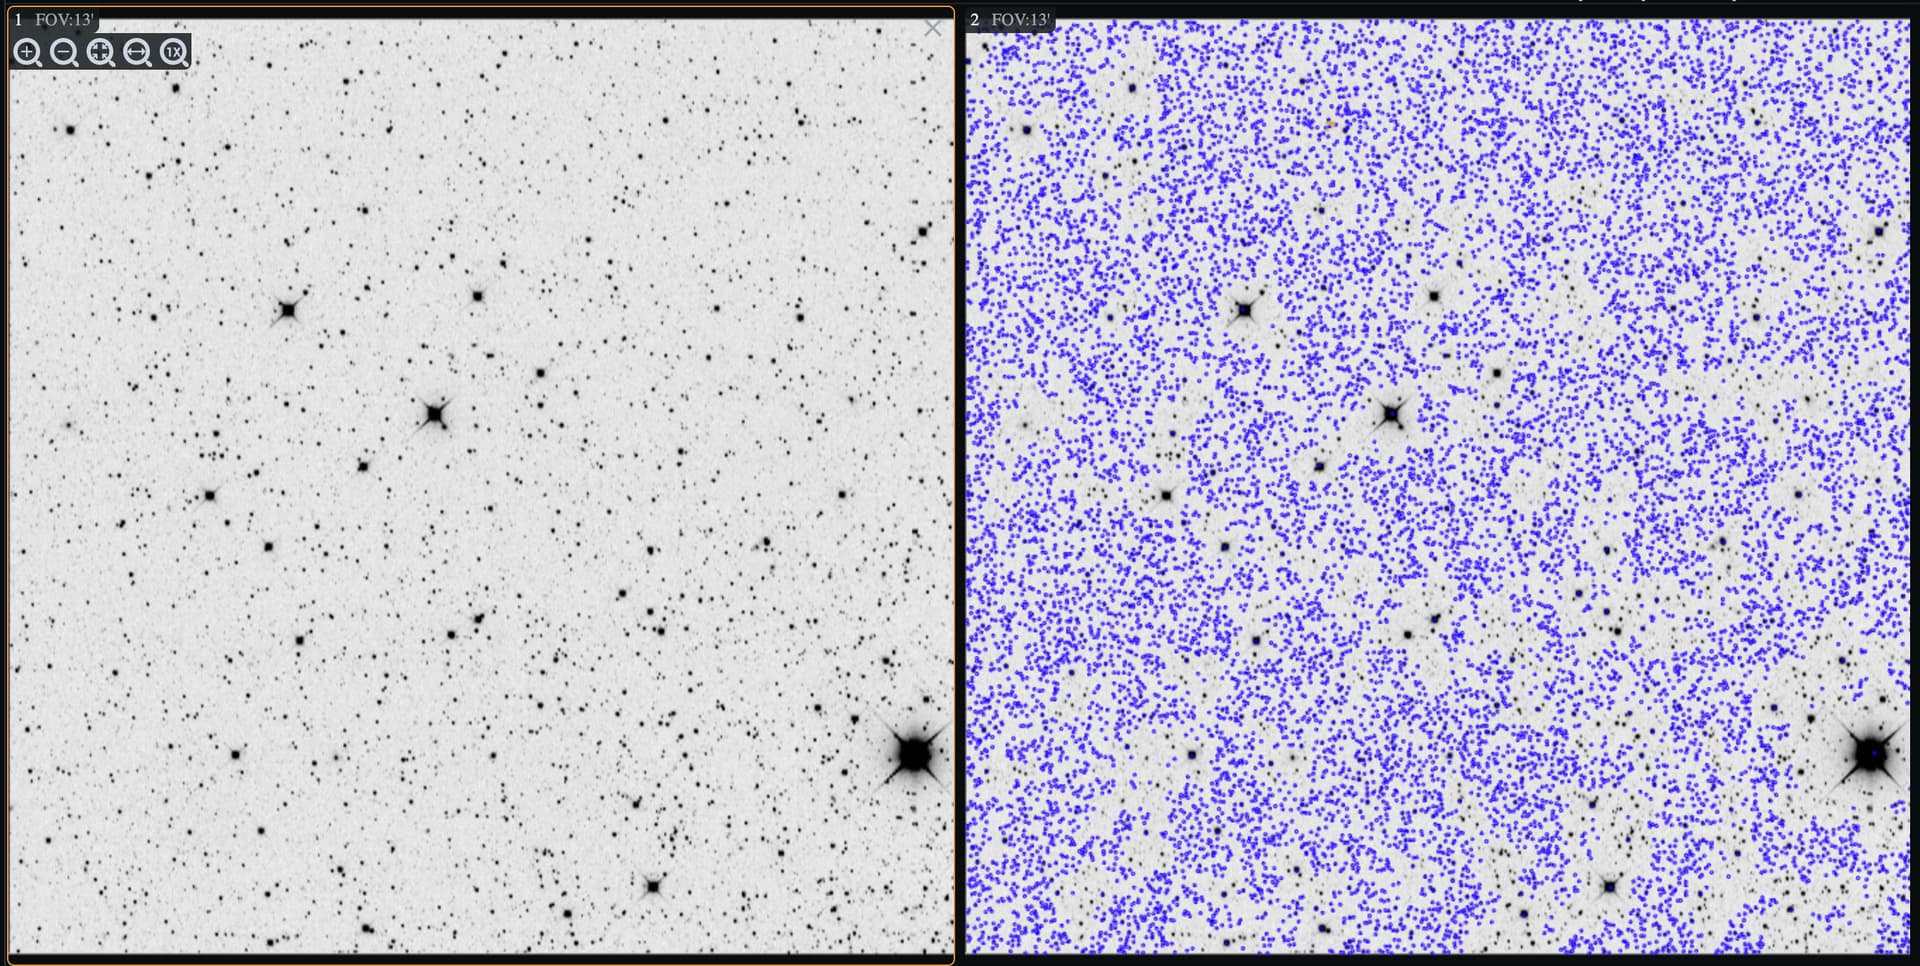
Another example (visitId = 2024112400110, detector = 0).
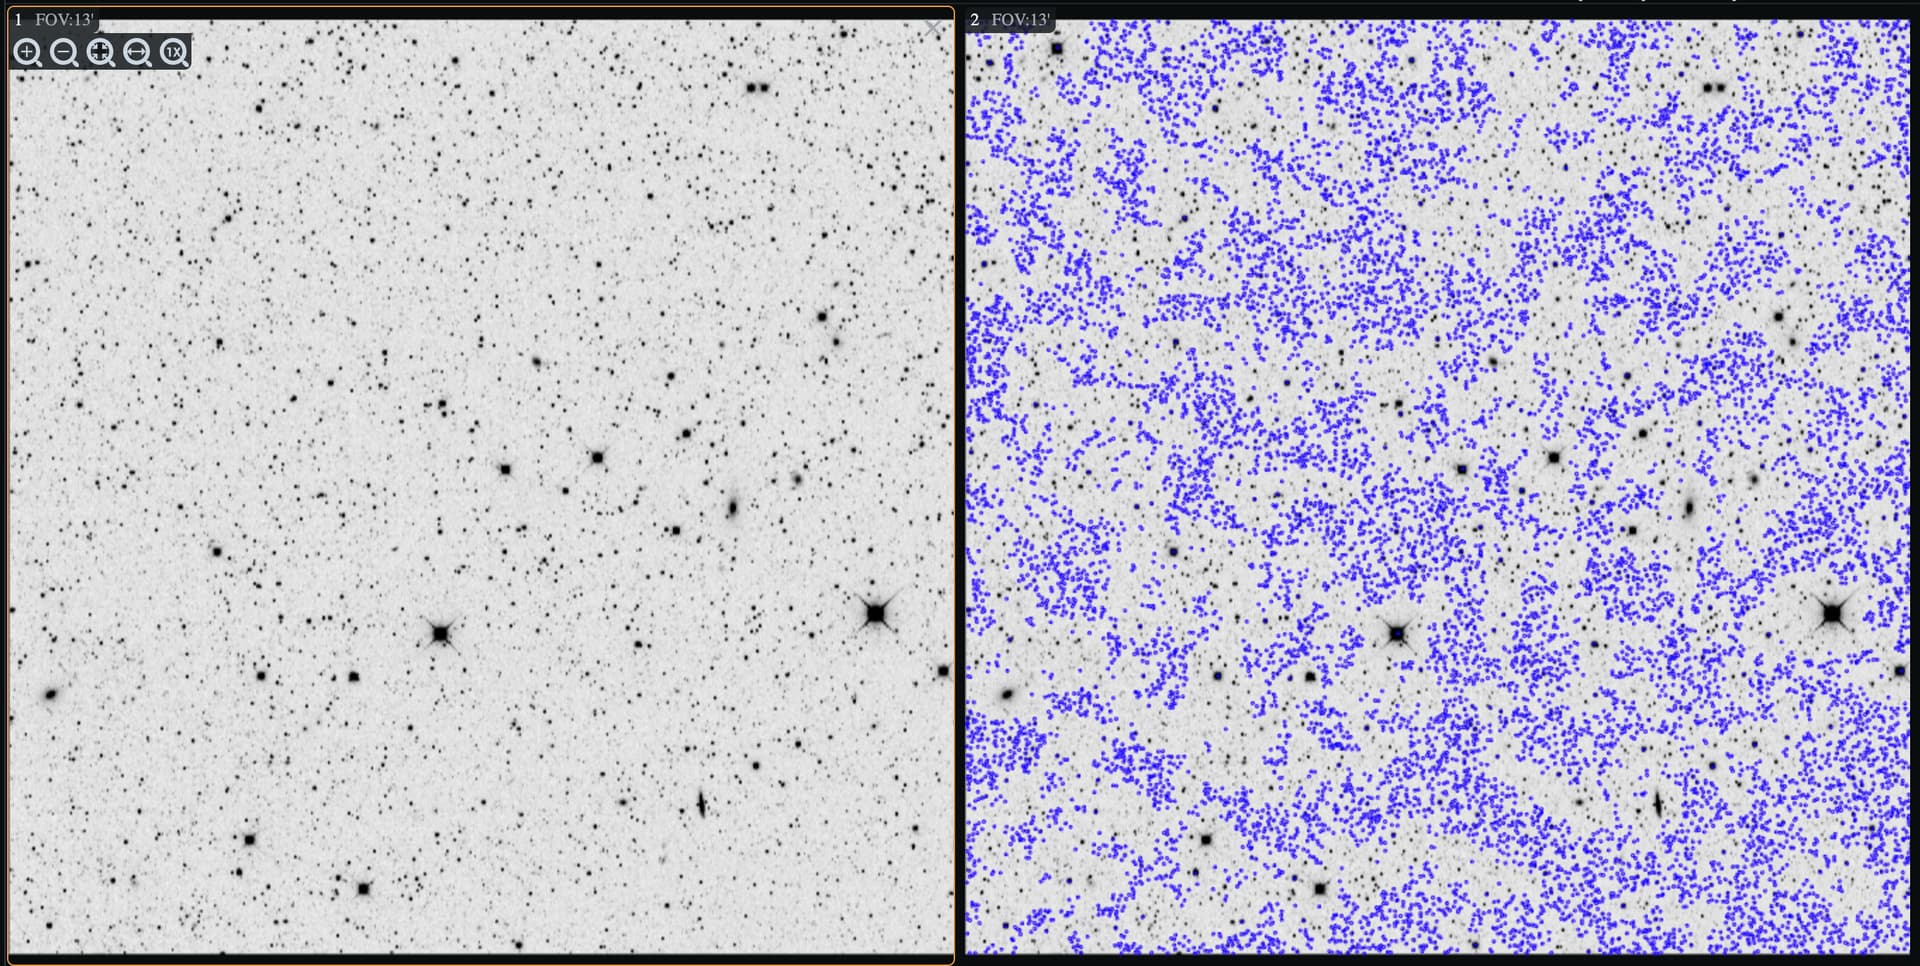
And last example of the Fornax Dwarf Spheroidal Galaxy (visitId = 2024120500032, detector = 6).
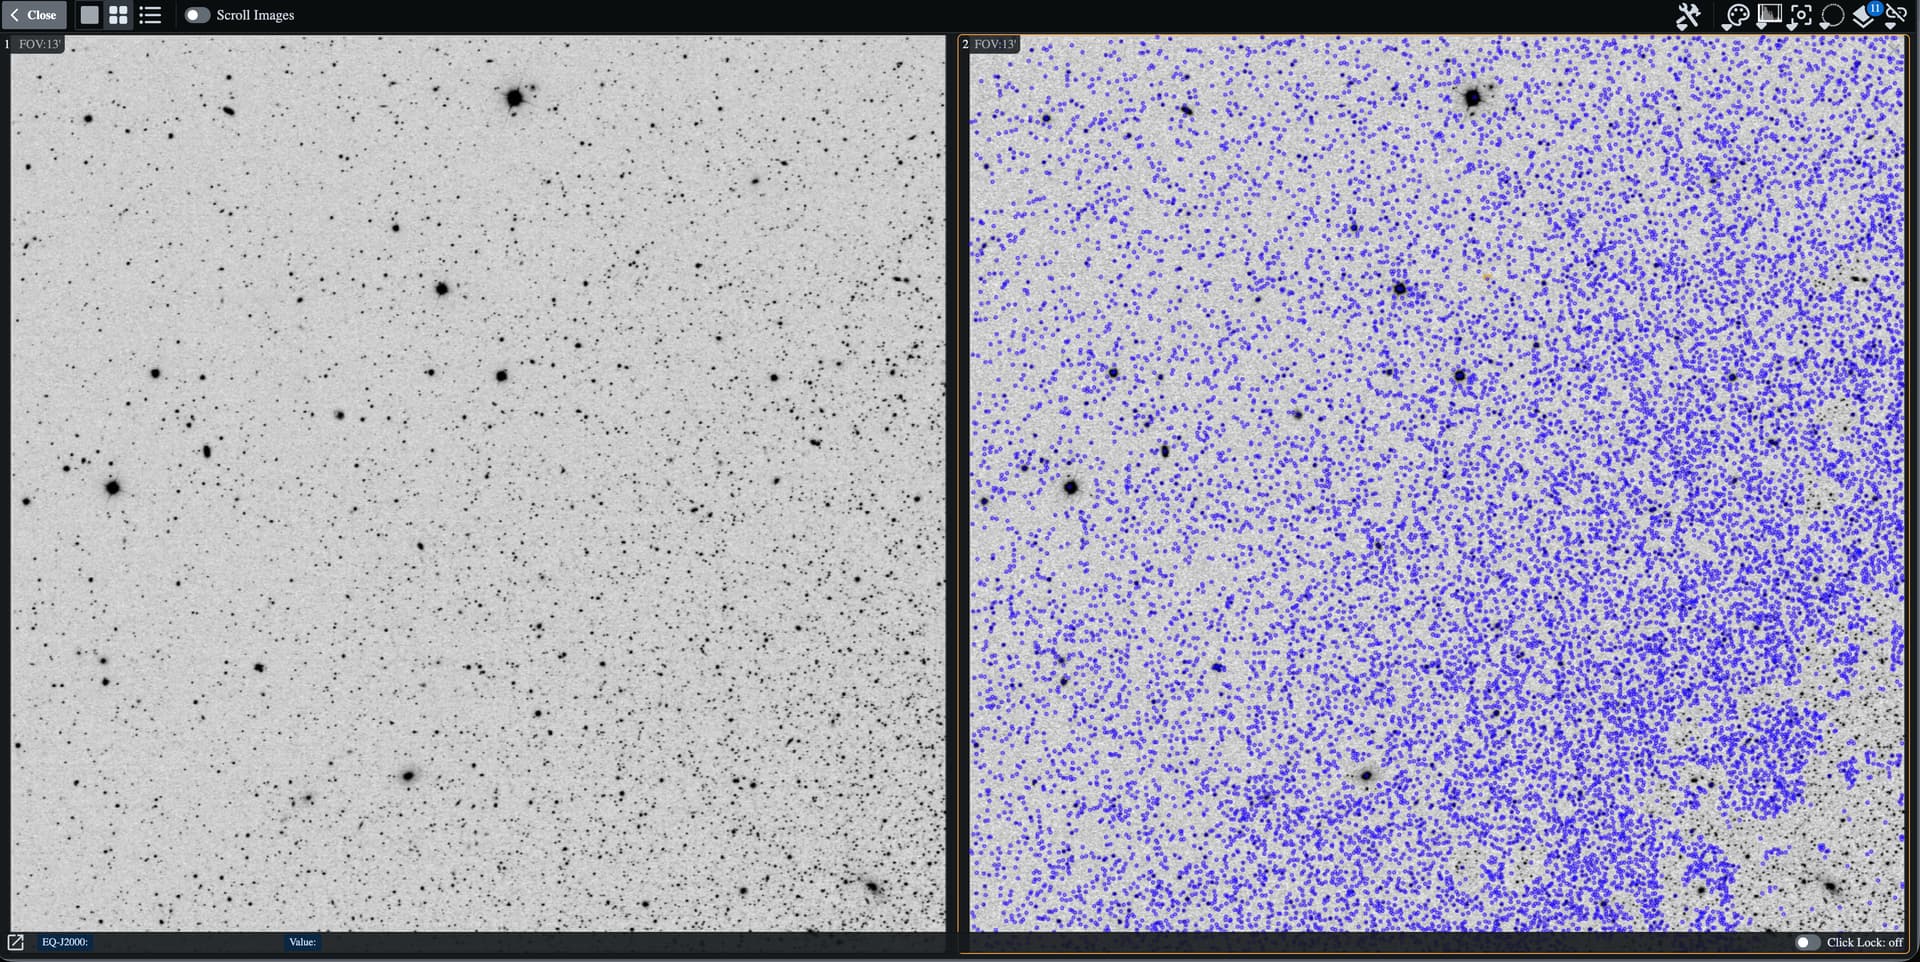
However, here is a successful attempt of the Fornax Dwarf Spheroidal Galaxy (visitId = 2024120500033, detector = 2)
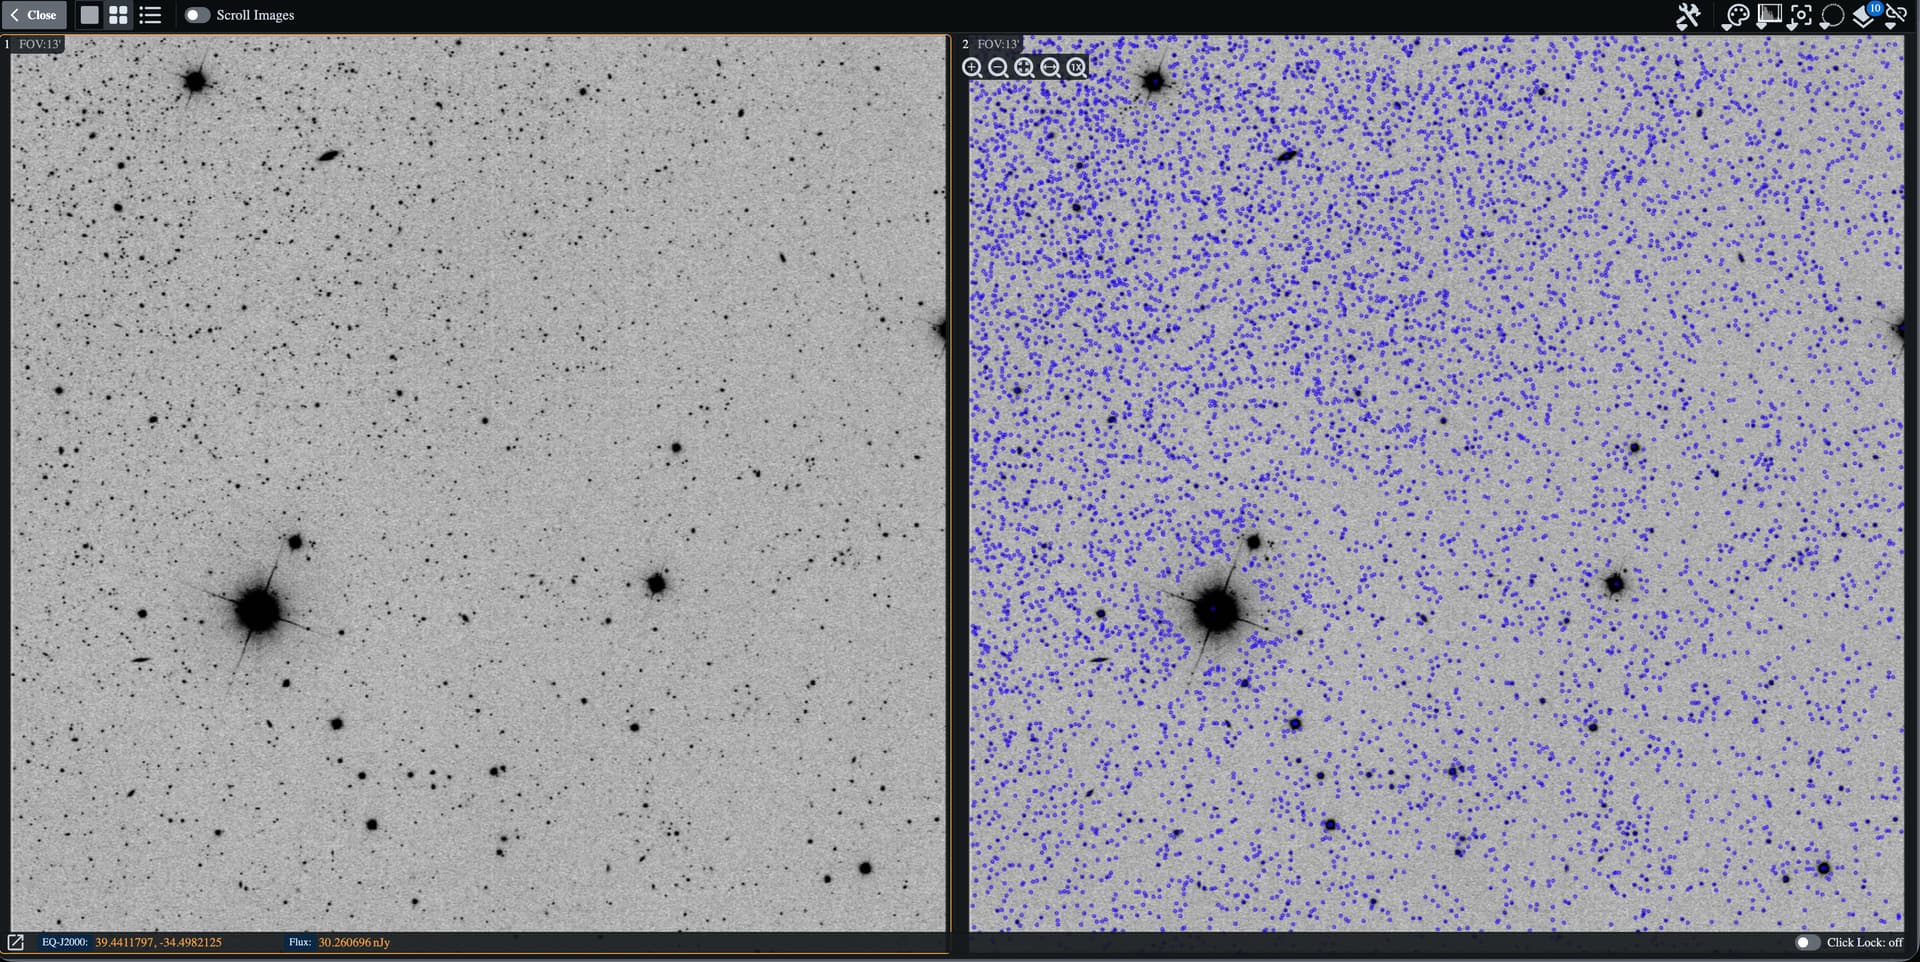
My program is pasted below, and my best guess is that ‘with disp.Buffering’ is causing this to happen, but the problem persists even without it. Please let me know if there is a problem in my program or if there is another factor at hand. Thank you!
from lsst.daf.butler import Butler
from lsst.rsp import get_tap_service
import lsst.afw.display as afwDisplay
import numpy as np
import firefly_client.plot as ffplt
from lsst.afw.image import ImageF
from astropy.table import Table

visitId = 2024120500033
detector = 2

service = get_tap_service("tap")
butler = Butler("dp1", collections="LSSTComCam/DP1")

dataset_refs = list(butler.query_datasets(
    "visit_image",
    where="visit.id = :visitId AND detector.id = :detector",
    bind={"visitId": visitId, "detector": detector},
))

for ref in dataset_refs:
    print(ref.dataId)

ref = list(dataset_refs)[0]
visit_image = butler.get(ref)
print(ref.dataId)

afwDisplay.setDefaultBackend('firefly')
afw_display = afwDisplay.Display(frame=1)

ref = list(dataset_refs)[0]
visit_image = butler.get(ref)

afw_display = afwDisplay.Display(frame=1)
afw_display.mtv(visit_image)
afw_display.setMaskTransparency(100)

query = f"""
SELECT
    src.sourceId,
    src.visit,
    src.detector,
    src.ra,
    src.dec,
    src.psfFlux,
    src.psfFluxErr
FROM dp1.Source AS src
WHERE src.visit = {visitId}
  AND src.detector = {detector}
"""

job = service.submit_job(query)
job.run()
job.wait(phases=["COMPLETED", "ERROR"])

print("Job1 phase is", job.phase)

if job.phase == "ERROR":
    job.raise_if_error()

results = job.fetch_result().to_table()

print(f'Sources: {len(results)}')
print(results[:10])

visit_id    = int(results['visit'][0])
detector_id = int(results['detector'][0])

mask = (results['visit'] == visit_id) & (results['detector'] == detector_id)
results_single = results[mask]

print(f"Sources on detector {detector_id}: {len(results_single)}")

wcs = visit_image.wcs

ra_arr  = np.array(results_single['ra'],  dtype=np.float64)
dec_arr = np.array(results_single['dec'], dtype=np.float64)

x_pix, y_pix = wcs.skyToPixelArray(ra_arr, dec_arr, degrees=True)

rubin_cat = Table({
    'x':    x_pix,
    'y':    y_pix,
    'flux': np.array(results_single['psfFlux'], dtype=np.float64),
})
rubin_cat.sort('x')
print(rubin_cat)

disp = afwDisplay.Display(frame=2)
disp.mtv(visit_image)
disp.setMaskTransparency(100)

with disp.Buffering():
    for y, x in zip(rubin_cat["y"], rubin_cat["x"]):
        disp.dot("o", float(x), float(y), size=6, ctype="blue")