In the Merian survey, we have been processing DECam data with the LSST pipe. We had a run around 2023ish for DR1, and we are running DR2 with the latest weekly. We find that the current pipeline adds large saturation masks at places where there are no obvious saturation patterns. Here is one example:
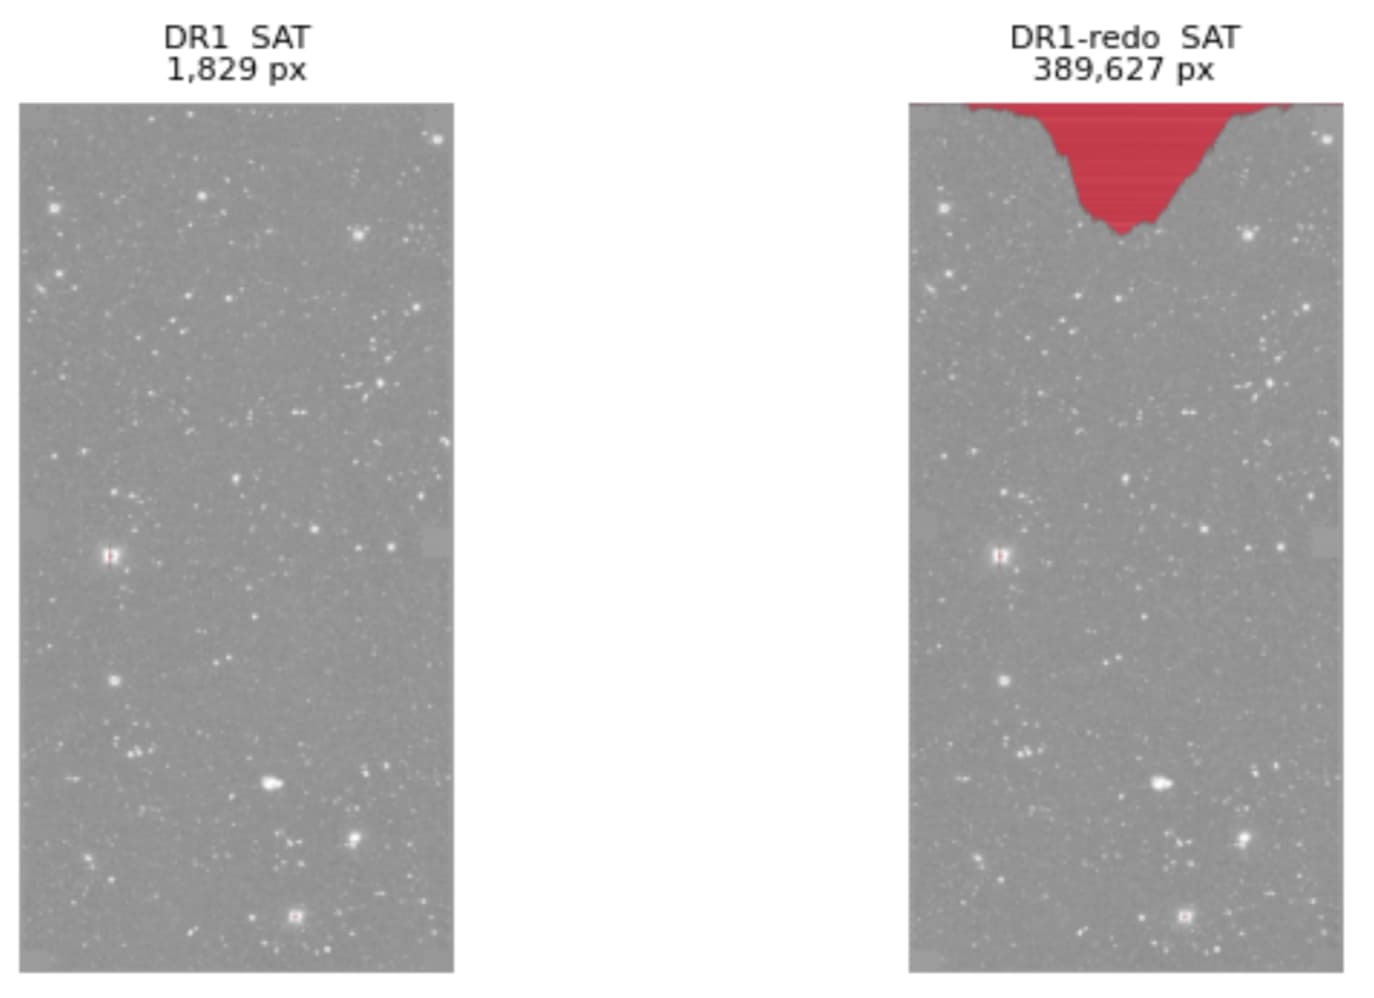
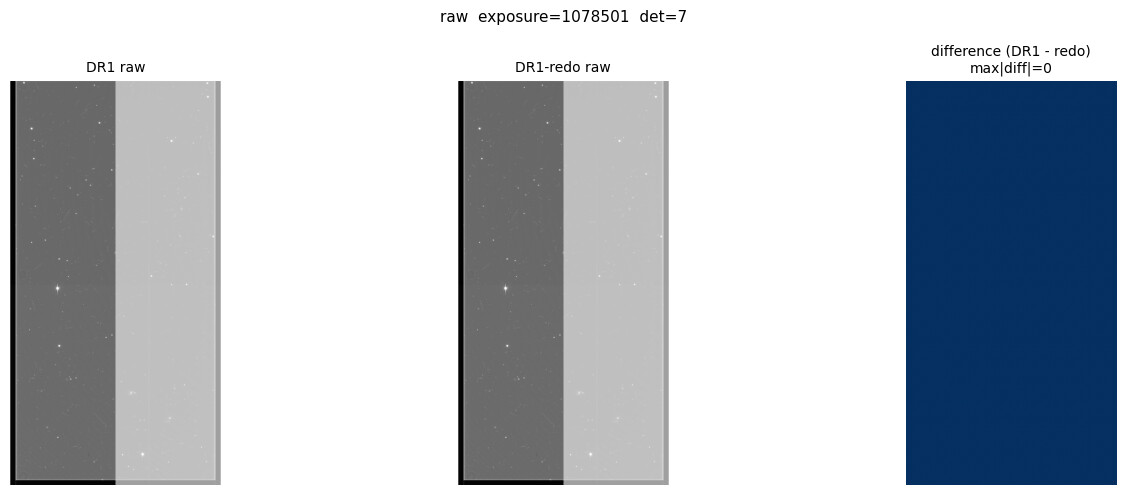
Left is the old run, and right is the new run. The large red patch on the right is the new saturation mask. The input raw data is the same between the two runs.
Do we understand why this is the case? It seems implausible that we could have such a big saturation region that doesn’t show up in the raw image. Thanks!
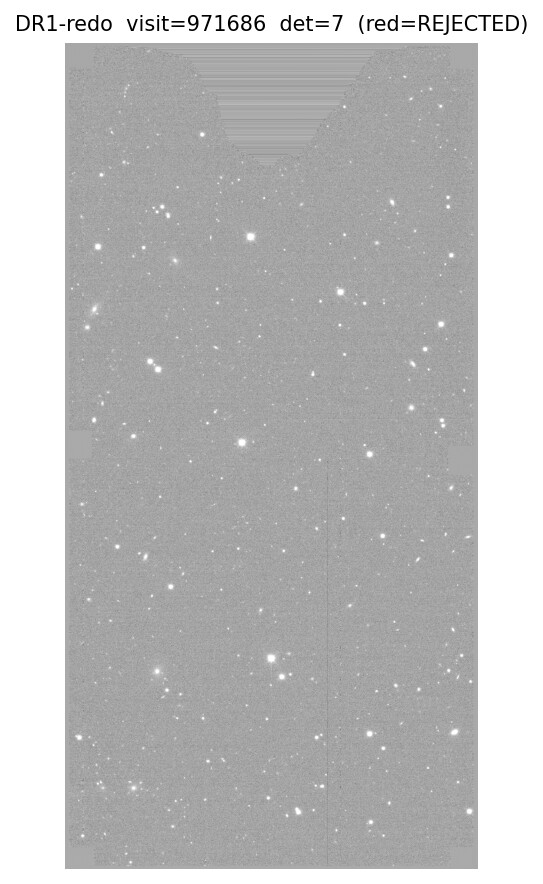
Hi @zhouconghao, thanks for posting. I’m not at all an expert here, but as a Forum moderator I can try to help. It at least looks like, from your second post, the masking is accurate – something has happened to the pixels during the “redo” processing that has caused some kind of issue.
I’m not sure what SkyFrame is, but if it’s an input to the “redo” processing, it sure seems like the culprit. On the other hand, if SkyFrame is the subtracted sky background, it makes sense that the error in the affected pixels also affects the SkyFrame.
I noticed you mentioned you were using the latest weekly of the LSST Science Pipelines. One thing might be to try the latest major release (v30) instead of the latest weekly. But I suspect in order for anyone else to help, it might take a little more digging on your part to narrow down where the affect on these pixels is being introduced in the processing, and what specifically changed in the relevant part of the code between your “original” and “redo” runs.
Could this be due to changes in the instrument signature removal (ISR) that mask for various problems in the LSSTCam sensors (e.g. ITL edge bleed or phosphorescence)? The algorithms that do this may need to be disabled in your ISR configuration.
As a Forum moderator, I’m checking in to see fi either Melissa’s or K-T’s suggestion helped resolve the issue with your saturation mask. If you found an alternative solution, please feel free to share it here so others can learn from it as well. Thanks!
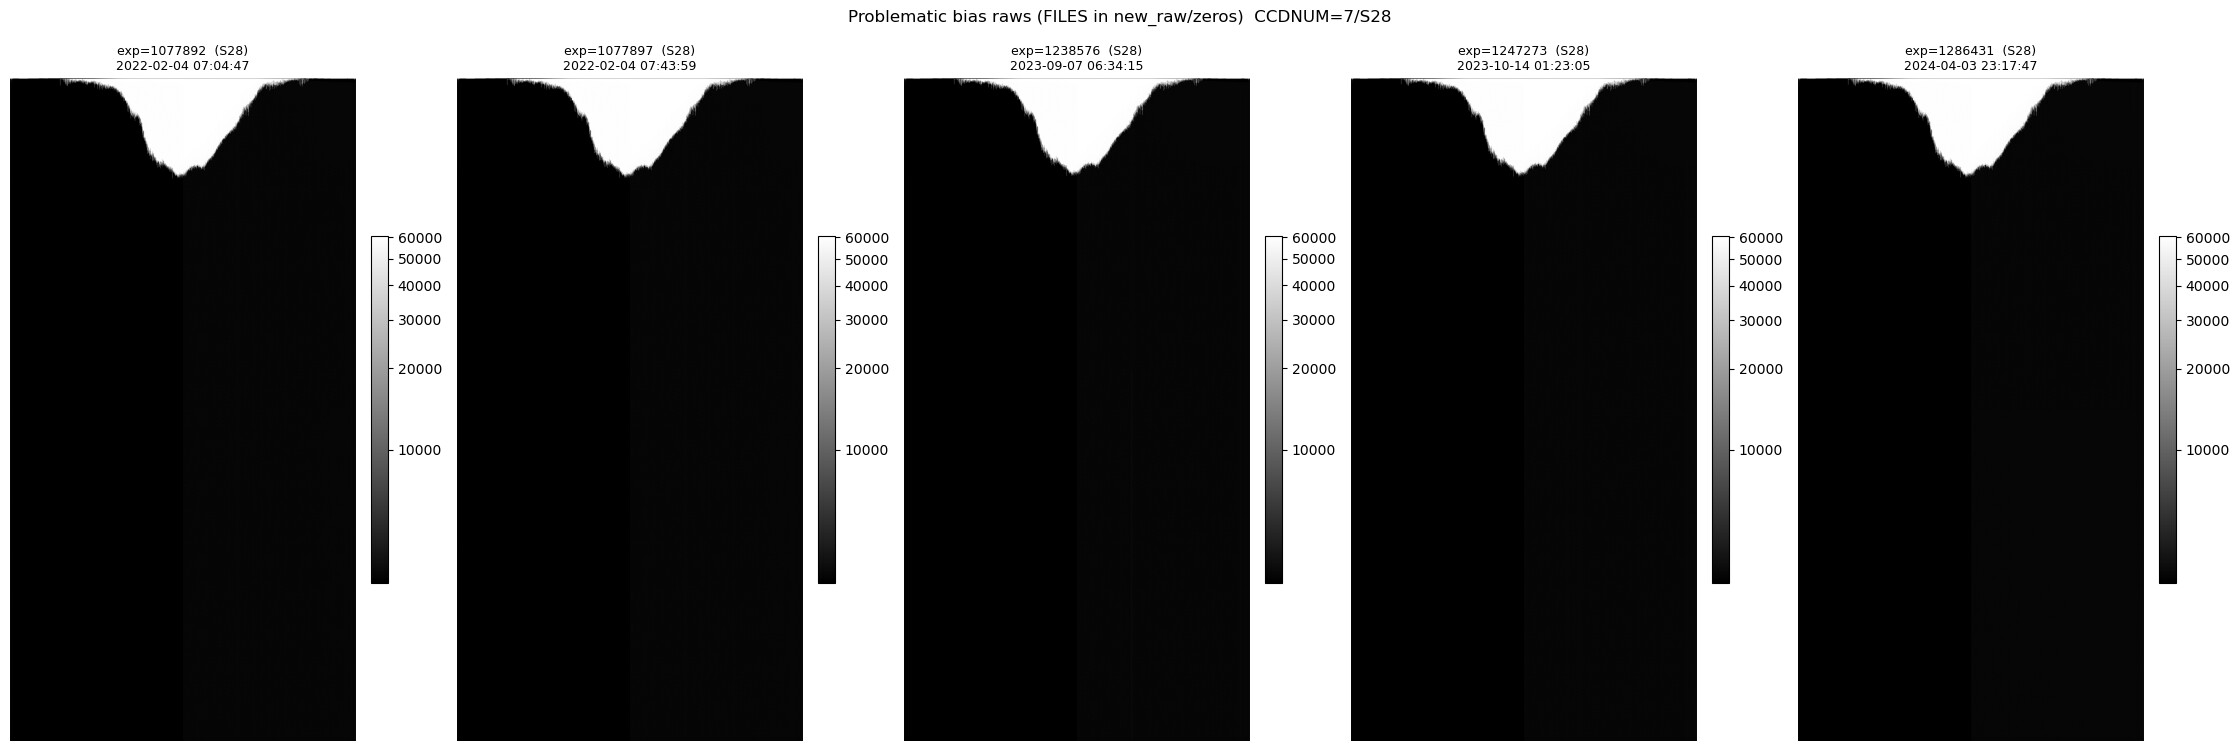
Both Merian DR1 and DR2 used the same problematic biases. The differene is in the cpBiasCombine.censorMaskPlanes task, not the inputs. DR1 (Feb 2025) used the default True, which clears all mask planes except BAD after combining — so the SAT triangle was erased. DR2 picked up the censorMaskPlanes: False DECam override from DM-52509 (lsst/cp_pipe@57fd429), so SAT now survives into the master bias and prints through into the flats.
DR1’s combine did include 7 of the 10 contaminated zeros (per CPP_INPUT), and its cpBiasIsrExp show the same SAT triangle — it just censored the mask before writing. So DR1 carries the same image-plane contamination, unmasked — which also explains why these never surfaced in DR1 reductions.