I’m writing to share the results of a hack session involving a few DP0 delegates at Carnegie Mellon after the July 22 DP0 delegate assembly.
Since the delegate assembly involved going through a tutorial notebook demonstrating the use of catalog queries with TAP, I decided to do the following:
- Carry out catalog queries with TAP to learn a bit more about how it works, in the context of catalog exploration.
- Design queries that would permit me to compare the DP0.1 and DP0.2 object catalogs. Since the object catalogs were produced by analyzing the same set of pixel data, differences might tell us something about the difference between v19 and v23 of the LSST Science Pipelines. This is somewhat similar to data exploration one might carry out with a new data release, when two releases have overlapping areas, so you start to explore and see what is different.
My code is available in a contributed notebook, the beginning of which is based heavily on the existing tutorial. Due to limited time available, I did not have the opportunity to review the other tutorials and see if there are better ways to make some of the plots - so I’m sure there are ways one could improve on this notebook.
My main conclusions from this exercise are as follows:
- The existing DP0 tutorial notebooks are incredibly useful as starting points that enable delegates like me to rapidly carry out non-trivial investigations of the DP0 dataset and learn about key functionality in the RSP. Many many kudos and thanks to the Community Engagement Team!
- Compared to previous surveys I’ve been involved in, the RSP offers functionality that is very advanced given that we are still well before survey start. It’s really amazing to have this much data inspection and querying machinery available (including interactive tools) and be able to start learning how it all works before the survey starts.
- The RSP’s TAP query service is convenient for basic catalog exploration, as it is possible to query regions of sizes containing tens of thousands of objects very rapidly (few seconds).
- SQL has some surprising features, including one that I thought was a bug but turned out not to be.
- The catalog schema have changed a lot from DP0.1 to DP0.2, which took a bit of effort to get used to.
- The catalogs themselves have not changed vastly, at least in the astrometry and cmodel photometry. The biggest changes seem to be driven by the change in the deblender, as Scarlet is now the default.
- There is room for a lot more interesting comparisons between DP0.1 and DP0.2, and between both of those and the truth catalogs. I’d be happy to work on this at a delegate assembly if others are interested. Besides what we can learn about the algorithmic changes (e.g., new deblender, but also newer photometry algorithms that are only available in DP0.2) I also think it mirrors some of the data exploration we might do early on with different processings of the LSST data in the same part of the sky, so it seems useful from that perspective.
Some illustrative plots are below.
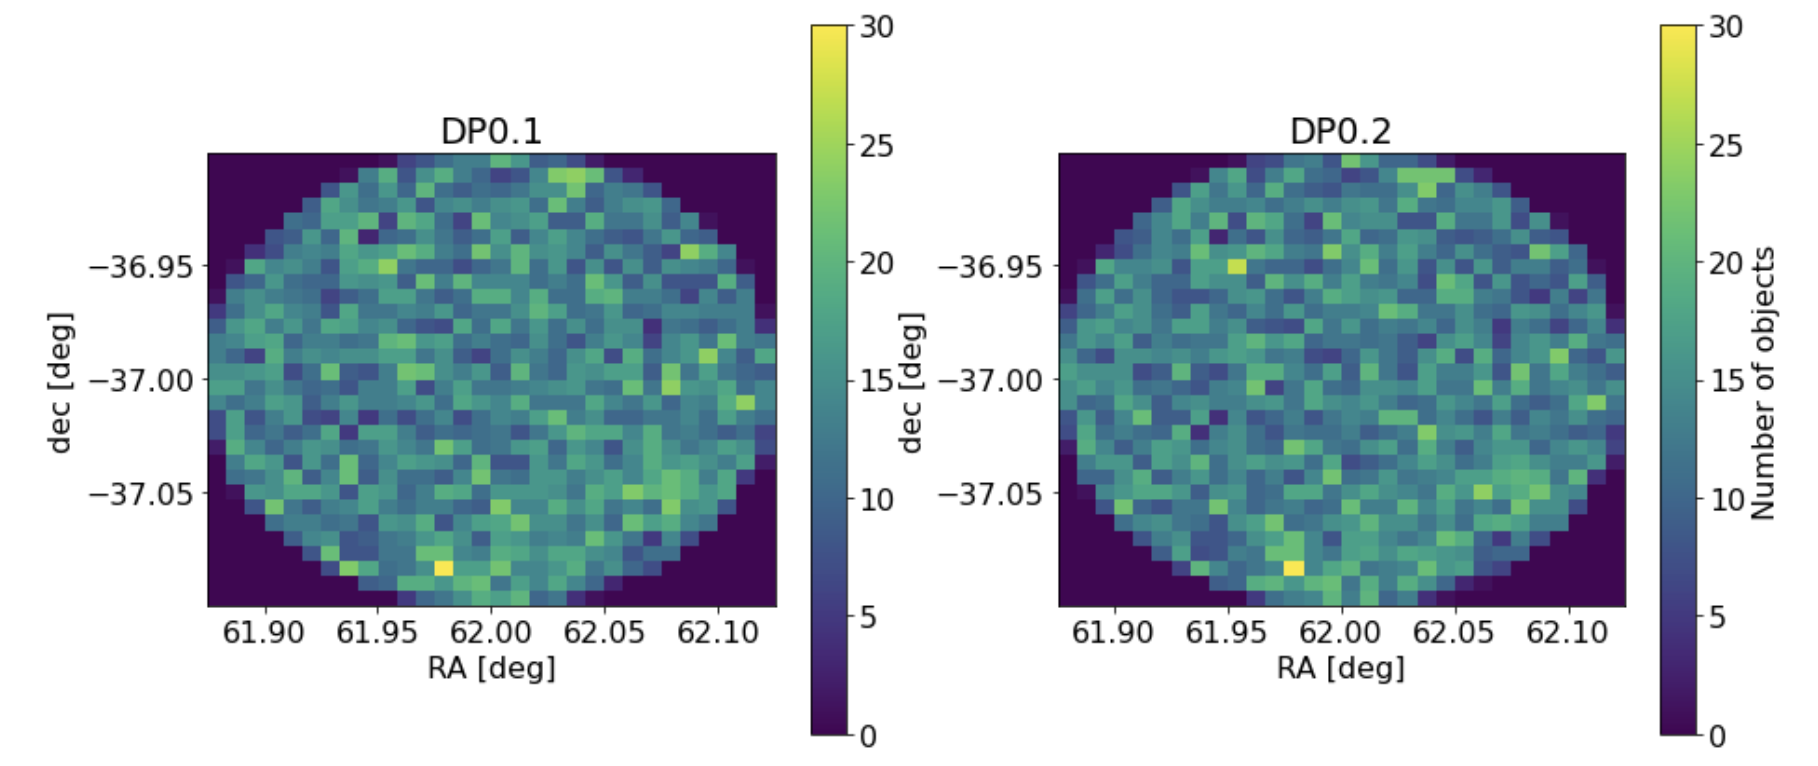
This is simply a 2D histogram of the detected object density with very basic flag cuts and an i-band magnitude cut, for DP0.1 and DP0.2 object catalogs. You can see that the fluctuations trace each other but they are not 100% identical.
I also cross-matched the catalogs to identify counterparts in DP0.1 and DP0.2, and for these counterparts, compared the cmodel magnitudes in the i-band. In the plot below, pink and blue solid lines are the median Delta(mag)=mag(DP0.2)-mag(DP0.1) for objects flagged as isolated by Scarlet vs. everything else. The dashed lines show the 10th and 90th percentiles of Delta(mag), which I used as a rough measure of the width of the Delta(mag) distribution.
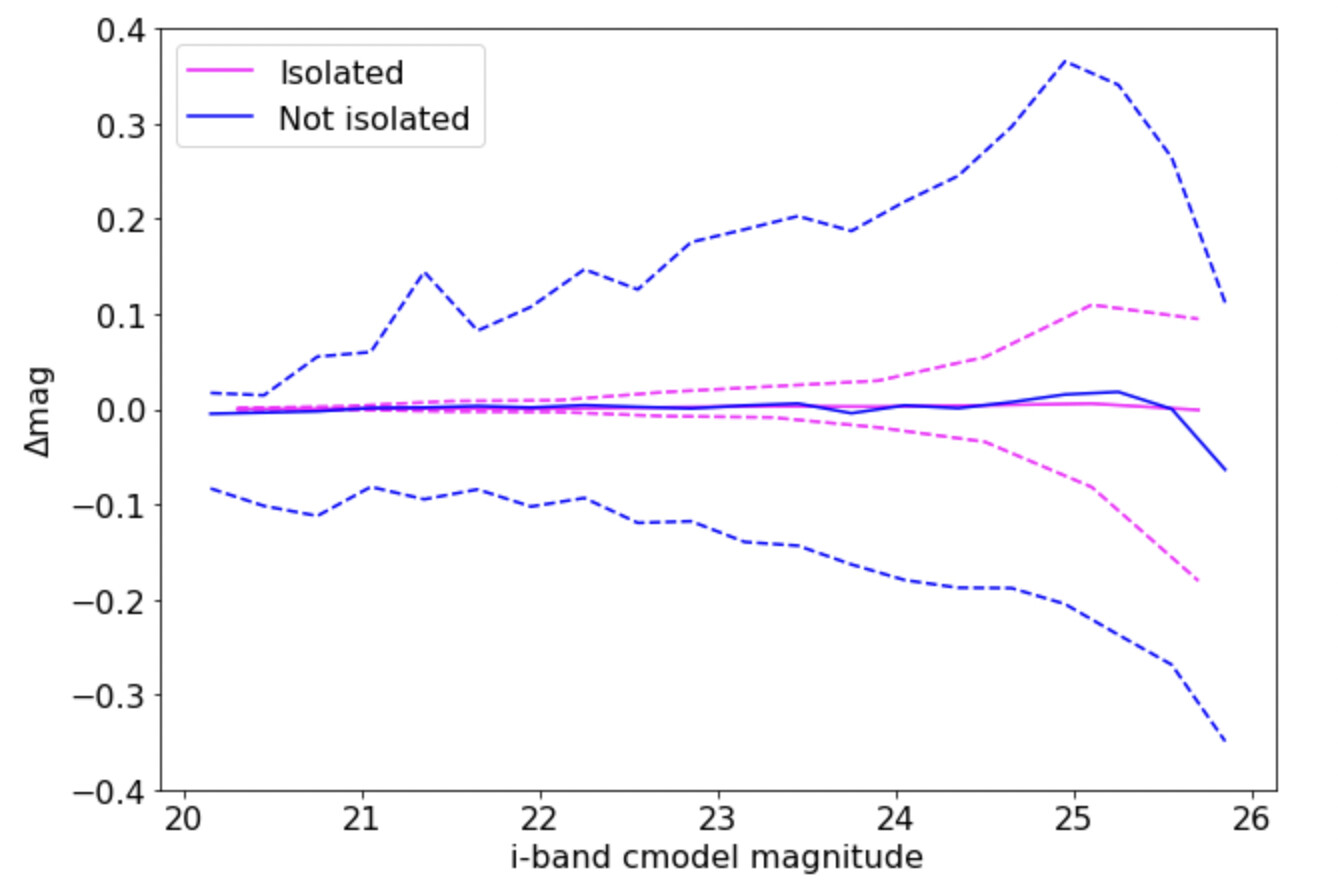
As shown, the ones flagged as isolated have a very narrow Delta(mag) distribution, indicating that the cmodel magnitudes in DP0.1 and DP0.2 are nearly the same, while the non-isolated ones have much broader Delta(mag) distributions. (The median Delta(mag)=0, implying that on average the magnitudes agree.) While not apparent from the plot, I checked and the isolated ones are ~25% of the sample.
This suggests (to me at least) that the change in deblender from DP0.1 to DP0.2 might be the primary cause for changes in the cmodel photometry, and that DP0.2 might be an interesting dataset for exploring the interaction between the Scarlet deblender and other algorithms.
Feedback on all this is welcome!