Is there a mechanism for users to request epochal images for specific sources ahead of the full DP2 release?
I have a 20th mag source in the Bulge for which I would like to extract a light curve by hand. My motivation for wanting to do this is that ZTF currently produces better epochal photometry for this source than DP2 does, despite ZTF’s 1.5–2″ PSF, far smaller aperture, and higher airmass. That comparison is alarming enough that I would like to inspect the images themselves to understand what is going on.
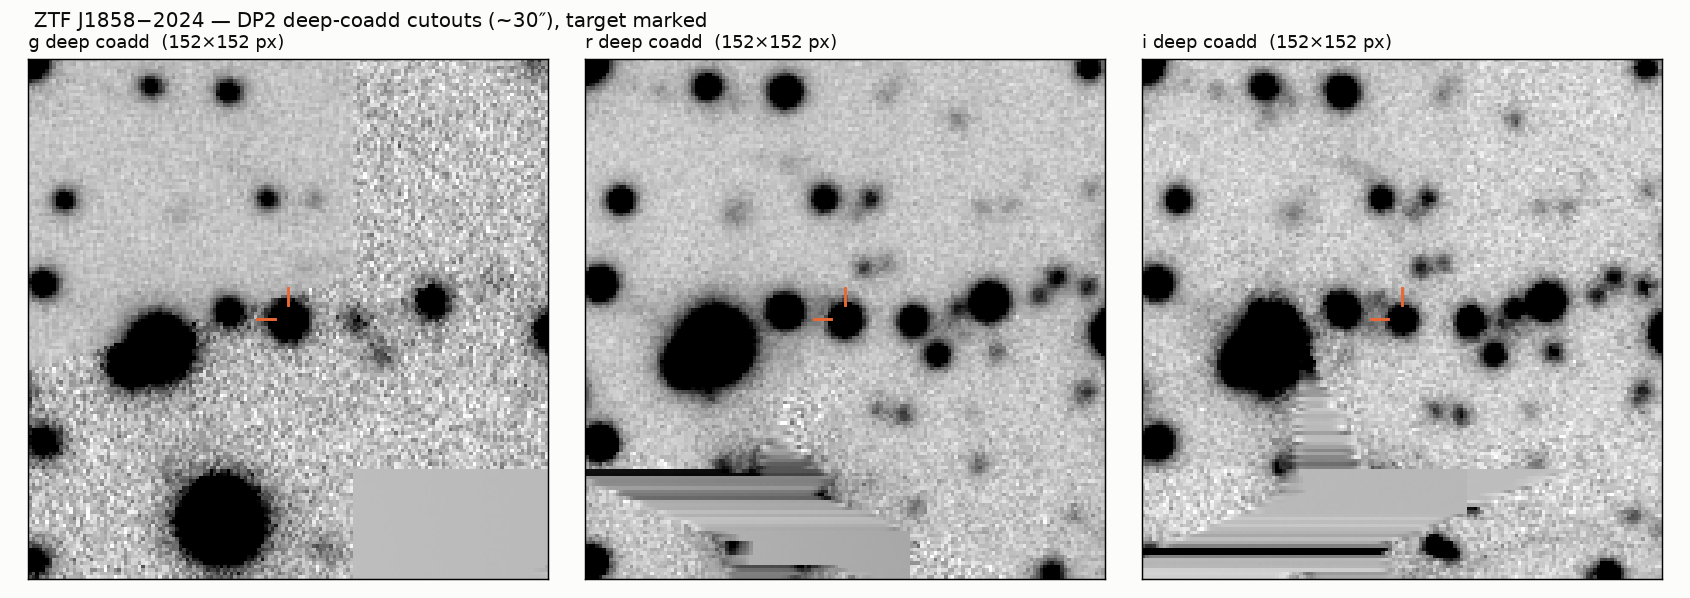
More broadly: is there a route for users to obtain specific sets of visit or difference images when they are trying to help debug or improve the photometric pipeline? I understand that the raw, visit, difference, and template images are scheduled for the full DP2 release in Oct–Dec 2026; my question is whether targeted requests are possible before then. Note that I do see some data artifacts in the deep coadd cutouts.
Hi @kburdge, as discussed in RTN-011, epochal images will be available in the full DP2 release later this year.
We may be able to diagnose the issues present here if you can provide us more detail–what is the EDP2 Object or DIAObject identifier you’re looking at, which flavor of Rubin photometry you’re using, and how the ZTF photometry compares.
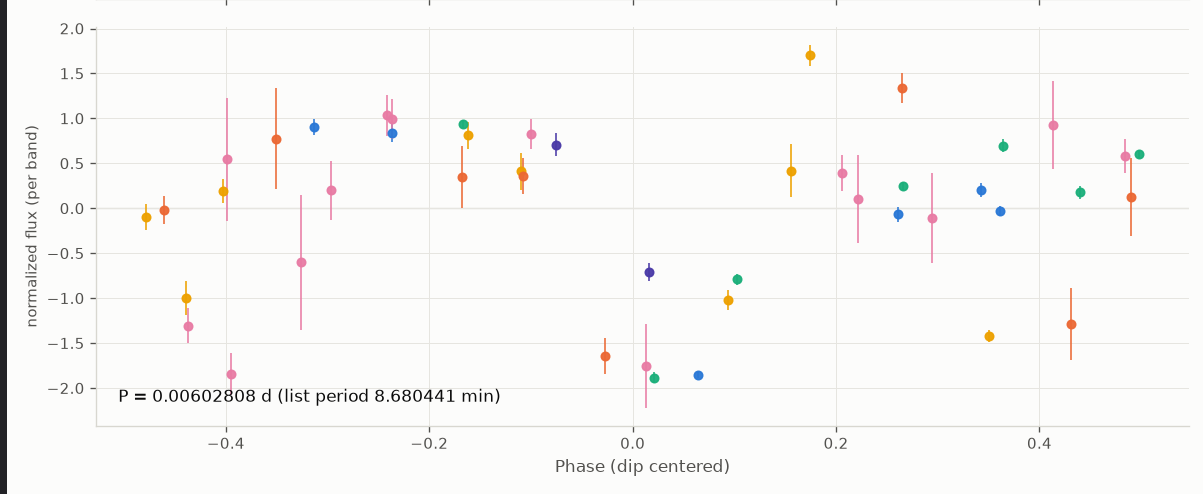
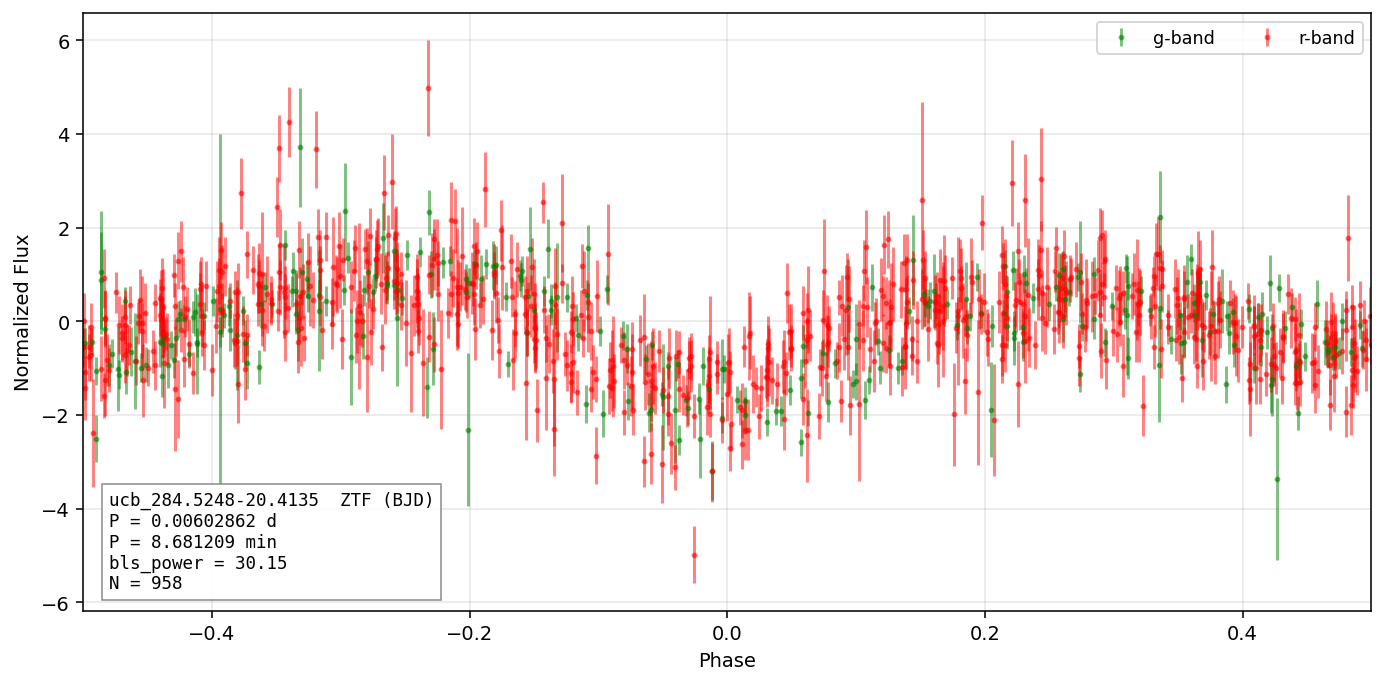
it’d be great if you could dig into it! I was using the DIAForcedSource photometry. See comparison plots below. The eclipse is visible in Rubin, but there are some catastrophic outliers in both directions (very positive points around phase 0.2 and very low points around -0.4 with small error bars) that wreak havoc on the periodogram, so I was trying to understand whether there are flags or anything else one could use to clean out such measurements. Coords are:
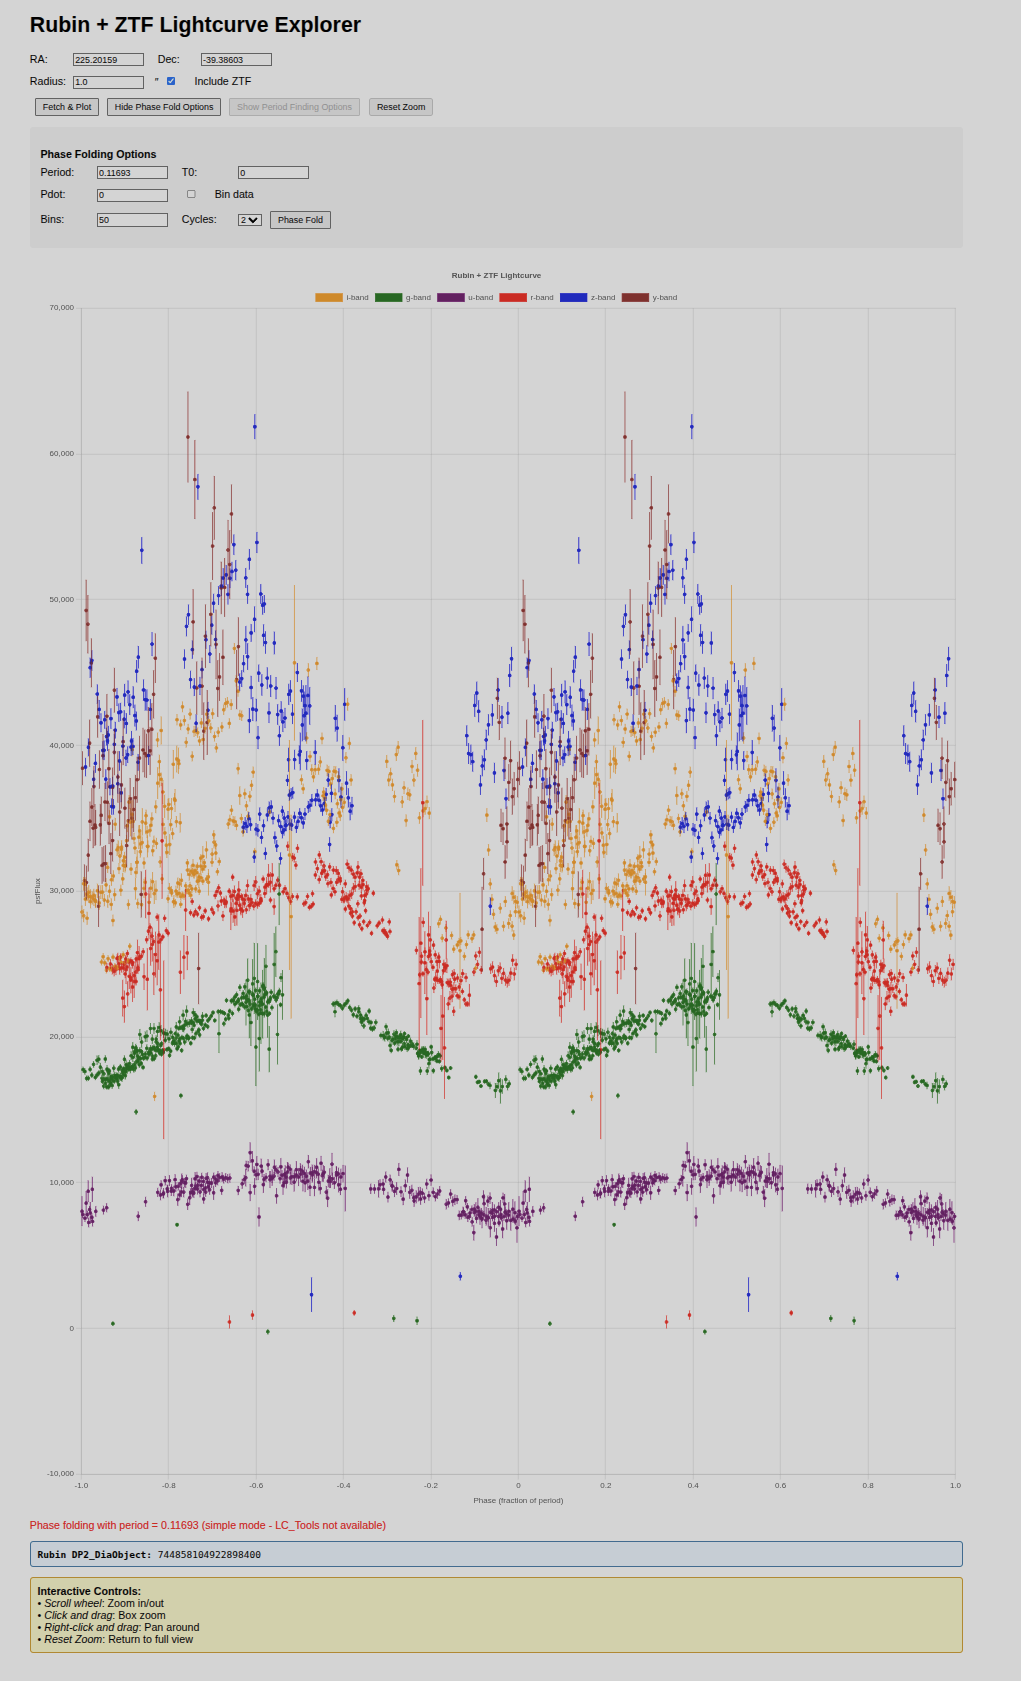
Another example I’m digging into is this source in a deep drilling field, which I blindly recovered in a period search of the data. The i and z band has something weird going on in it that I’m hoping to diagnose–could it be fringing or a detector artifact? Coords are 225.20159, -39.38603, and my best guess at the period is ~0.11693 days
The documentation for photometry flags in EDP2 is still under development and mostly based on DP1, but many flag columns are the same so this advice might be informative and helpful: Flag usage guidance — DP2. That page provides table-specific guidance regarding which flags to apply for typical science-quality selections. It is up to the user to adapt this guidance to their specific science applications:
Having taken a quick look at the ForcedSourceOnDiaObject rows for diaObjectId = 764015926805792022, I can see 14 of the 49 forced flux measurements have at least one flag column as “True”. Your second object has a lower fraction flagged, 35 out of 1765 measurements, which I’m not sure will be able to entirely account for the “something weird”. But it’s also hard to tell in the second plot which photometry is from Rubin and which is ZTF.
Until the individual visit images are released, the recommended approach is to use the flags and measurement uncertainties in the scientific analysis to ‘clean’ the datasets, as appropriate for the science goals.
Since the original question of whether epochal DP2 images are available has been resolved, and the only answer that currently exists is to explore use of the photometry flags, I’m going to preemptively mark this topic as solved but as always, feel free to unmark and continue the discussion or open a new topic for new questions (related to this one, or totally new) any time.
HI @kburdge, I’m not sure if anyone got back to you in more detail about your second example, but I took a few minutes to look into it using the “305.1. Variable star light curves” notebook. Below are a summary of some of the things that I found, in the hope that they may be helpful for you…
There are 3 objects located within 1.0 arcsec of your target ra, dec = 225.20159, -39.38603
None of these appears to have the same diaObjectId that is listed at the bottom of his screenshot (DiaObjID = 744858104922898400), but I’m not sure where that is coming from.
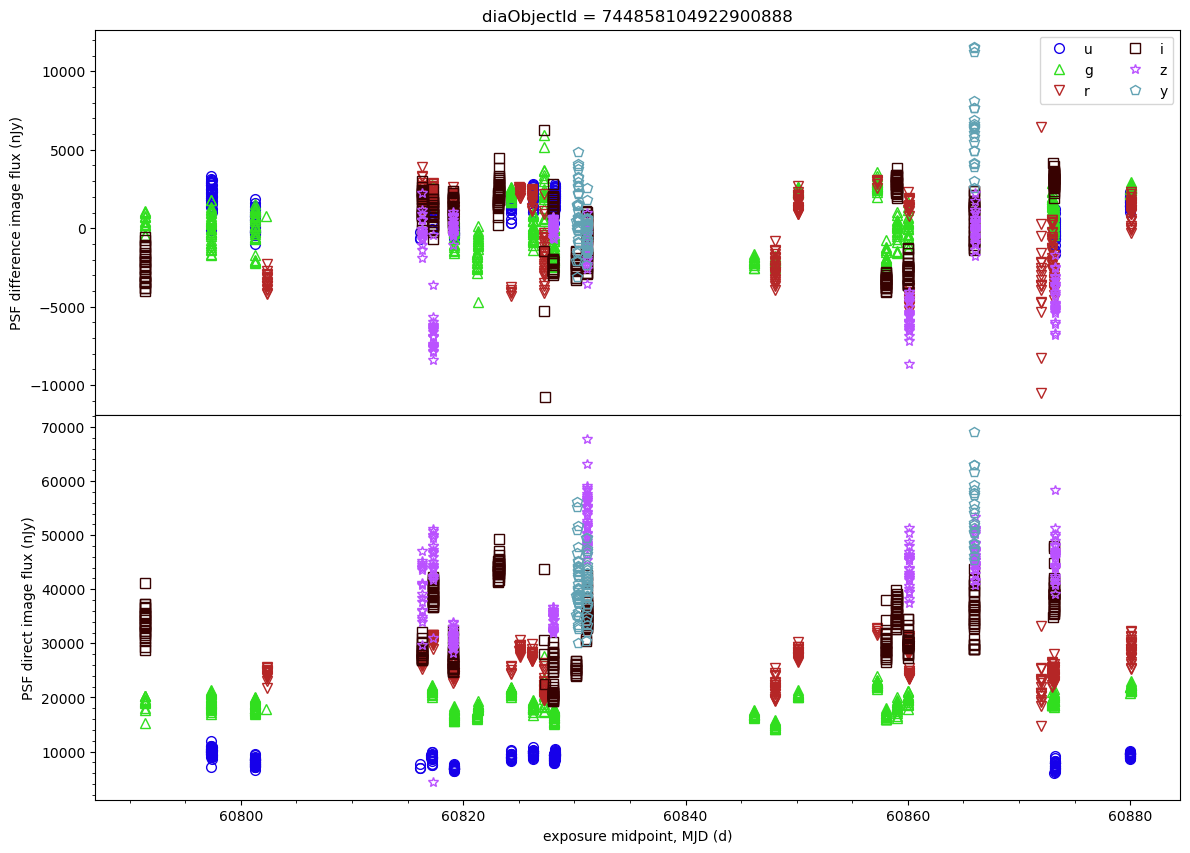
Taking one of the diaObjectId’s from my TAP spatial search (744858104922900888), I find 1765 visits. (There are similar numbers of visits for either of the two other diaObjectIDs). I’ve attached the light curves.
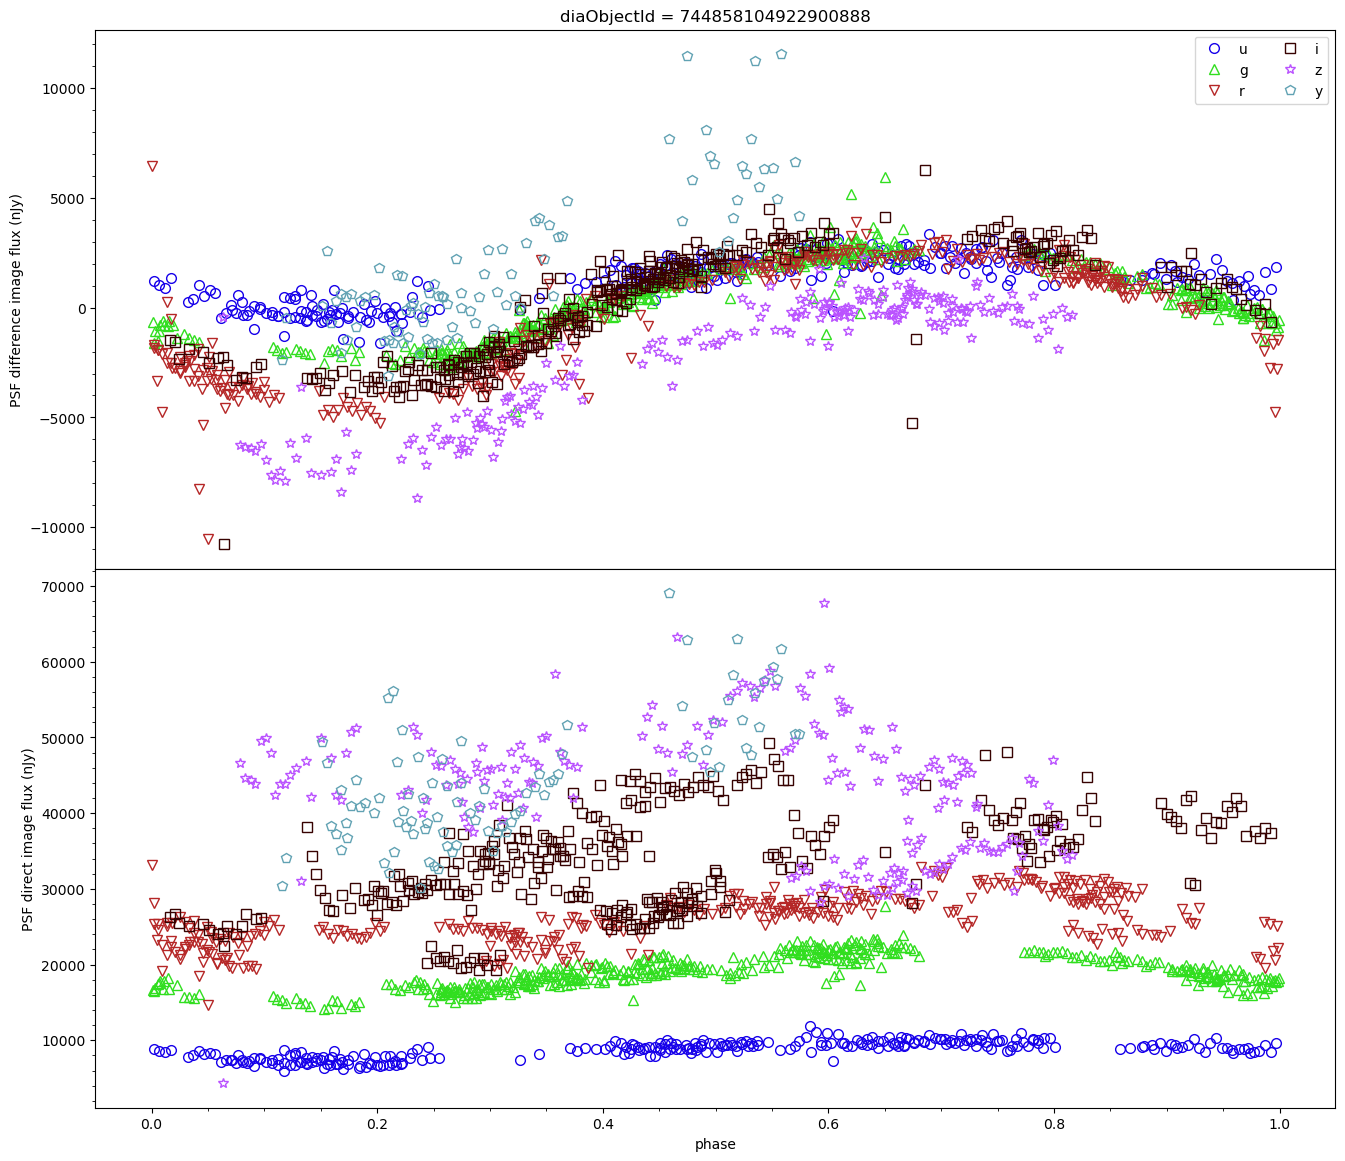
I phase folded with your reported period (0.11693) and looked at both the direct and difference image flux. The PSF difference image flux (psfDiffFlux) looks ok to me, but I do see the weird double locus in direct image flux (psfFlux) of the i,z bands. The guess is that in some of the direct images measurements the PSF is pretty bad and this contaminates the light curve for the source of interest, while in the difference image this flux is modeled and subtracted off. It might be interesting to look at a few single-visit and DIA images.
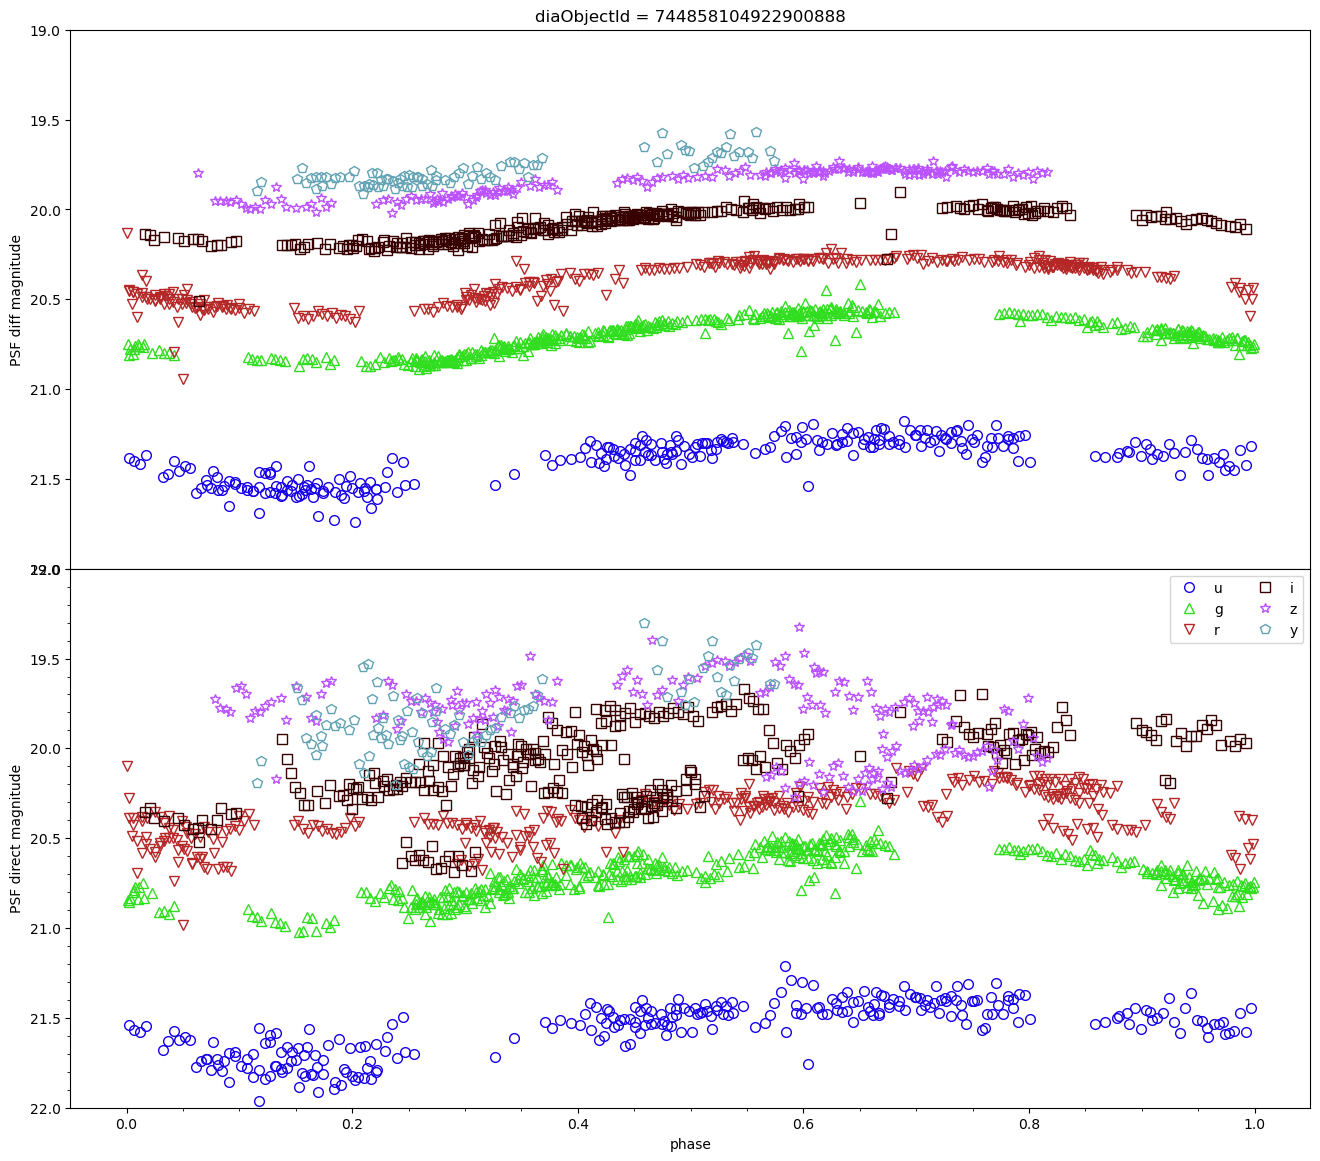
Translating from flux to magnitude is easy to do for the direct measurements, but for the difference image measurements you need to add back the mean or median flux of the source. I’ve added some code to do this below (YMMV). As would be expected from the flux, the direct magnitudes don’t look great, but the difference image magnitudes look ok.
direct_mag = forced_source['psfFlux'].to(u.ABmag).value

median_flux = np.zeros_like(direct_mag)
for band in ['u','g','r','i','z','y']:
    sel = forced_source['band'] == band
    median_flux[sel] = np.nanmedian(forced_source['psfFlux'][sel].value)

diff_mag = np.zeros_like(direct_mag)
diff_mag = (forced_source['psfDiffFlux'].value * u.nJy + median_flux * u.nJy).to(u.ABmag).value