Hello,
The DP1 schema for the DiaSource table describes the snr field as the “ratio of apFlux/apFluxErr”.
However, this quantity appears to be sensibly different. Actually, the snr is more similiar to the ratio of psfFlux/psfFluxErr, yet not identical still. Here’s a MRE, which results in the plot just below.
from lsst.rsp import get_tap_service
import matplotlib.pyplot as plt

service = get_tap_service("tap")
results = service.search("SELECT * FROM dp1.DiaSource WHERE visit=2024120900334")
df = results.to_table().to_pandas()

plt.plot([0, df["snr"].max()], [0, df["snr"].max()], ls="dashed", c="lightgrey", zorder=-1, label="identity")
plt.scatter(df["snr"], df["psfFlux"] / df["psfFluxErr"], label="psfFlux", s=5)
plt.scatter(df["snr"], df["apFlux"] / df["apFluxErr"], label="apFlux", s=5)
plt.xlabel("snr"); plt.ylabel("flux-err ratio");
plt.legend()
plt.show()
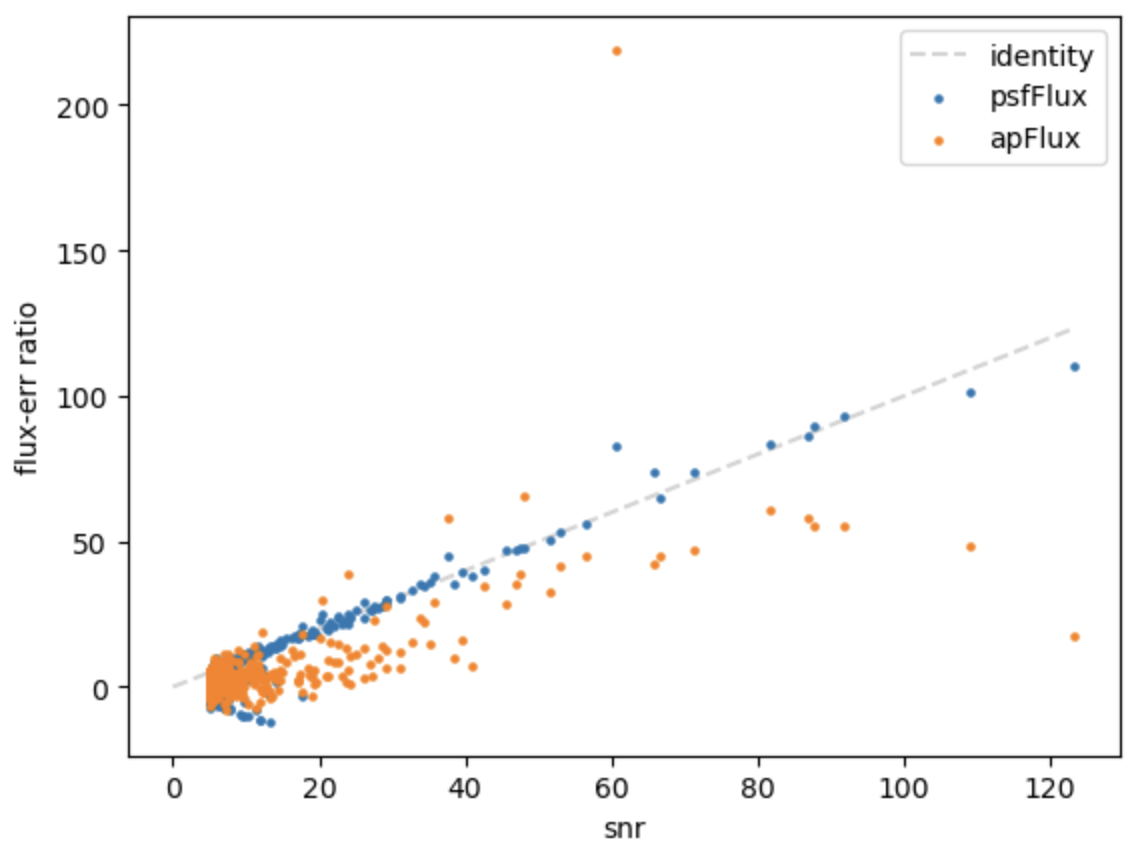
How is the SNR computed in the DiaSource table? Is the description of the snr field wrong?
Thank you.