I would like to explore the whole DC2 dataset by using the data organisation according tracts and patches.
I mean I want to retrieve all the objects belonging to a tract and a patch from the dp01_dc2_catalogs.object table.
I am able to get from a query to the TAP service on dp01_dc2_catalogs.object table the list of tract numbers.
But then I would like to have access to the information associated to each tract and patch, ie its center, its corners (in radec). I have seen that the butler is aware of the skymap collection.
I am able to access from the butler to a skymap object
But it is not clear how to get the list of tracts and patches from skymap, because skymap methods ask for (ra,dec) argument.
I don’t want to provide the (ra,dec) argument because precisely I want to explore the tract-patch structure independently.
Is there an example of code doing this ?
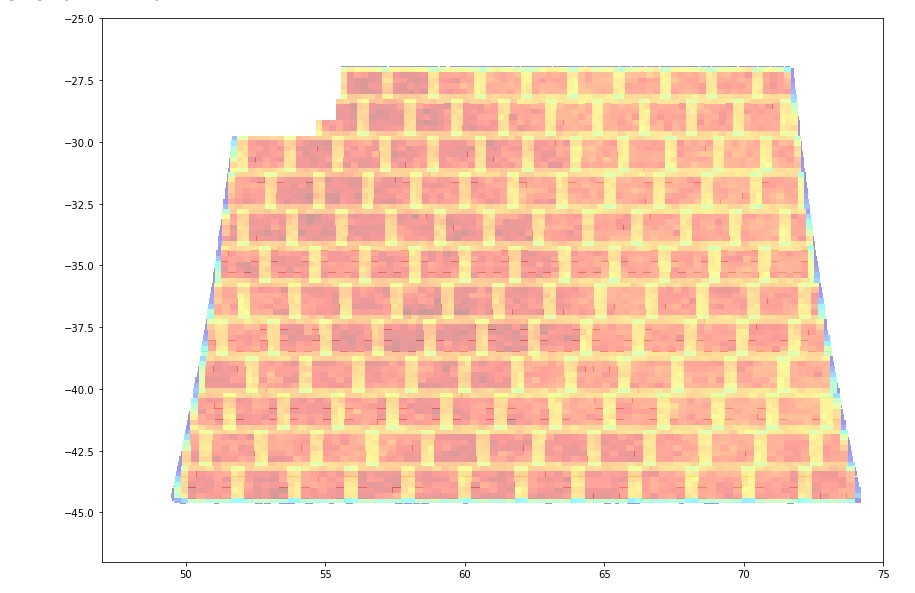
You can think as if I want to draw a plot of the tract-patch structure in a 2D figure (in ra,dec) coordinates.
After this I would like to retrieve all the object in dp01_dc2_catalogs.object table within given patch, probably by providing the radec corners of the patch.
Thanks for your help.
Be warned, however, about downloading the whole DC2 tract-by-tract (or patch-by-patch). I’ve tried this with asynchronous TAP queries, and it still takes a long time (16+ hours). I’ve been told it is better – when possible – to do analyses within the database as much as possible (instead of downloading the data into a pandas dataframe and doing the analysis on the pandas dataframe).
Many thanks, that’s look very nice. We can see the patches within the tract. However it is obtained from the objects table, not by a pre-defined configuration of tracts and patches. I wonder what kind of information a skymap object includes about the definition of the geometry of the survey.
To explain : where is stored the static information allowing the DM-stack pipeline to decide such object belong to this tract and this patch. I am sure such kind of database exists.
Thanks Douglas,
I am pretty sure that it is bad to download the whole objects of all the tracts. However if one ask for a restricted number of features like ra, dec, redshift for one tract, I don’t have to wait a lot.
Sorry I thought you were just after a way of seeing the tracts/patches structure.
How about
numTracts=0
patches = []
for tractID in tract_list:
for tractInfo in skymap:
if tractInfo.getId() == tractID:
# print(tractID)
for patch in tractInfo:
numTracts+=1
#print(patch)
ibb=patch.getInnerBBox()
tWCS=tractInfo.getWcs()
corners = []
for corner in ibb.getCorners():
p = geom.Point2D(corner.getX(), corner.getY())
coord = tWCS.pixelToSky(p)
corners.append([coord.getRa().asDegrees(), coord.getDec().asDegrees()])
#print(corners)
polygon = Polygon(corners,True)
patches.append(polygon)
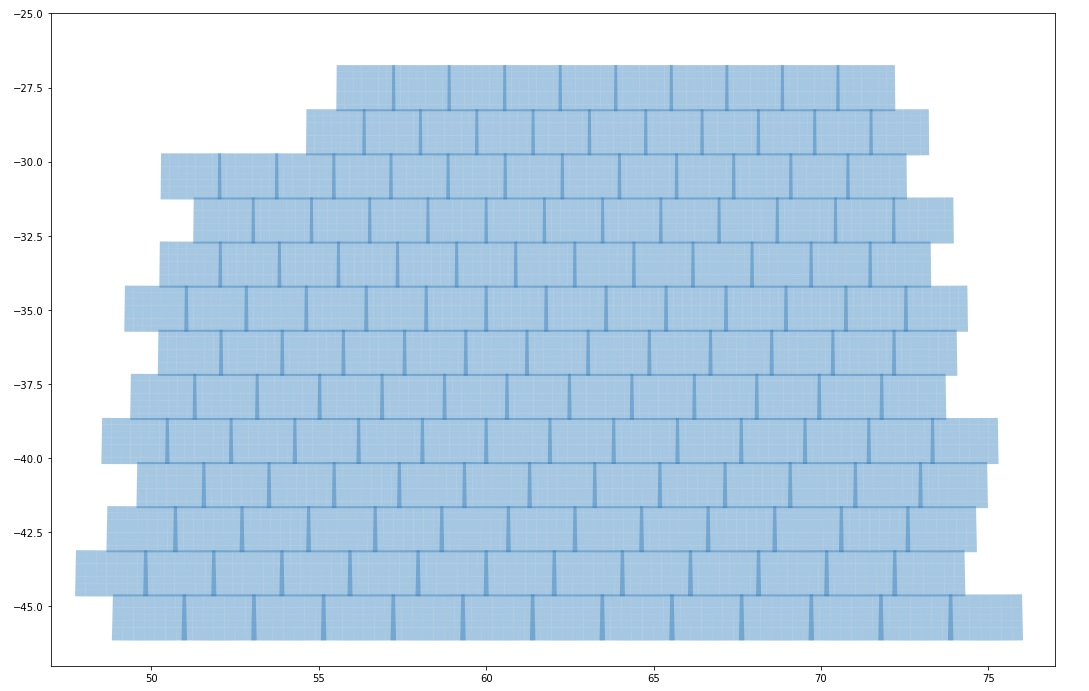
print(numTracts)
fig, ax = plt.subplots()
p = PatchCollection(patches, cmap=matplotlib.cm.jet, alpha=0.4)
ax.add_collection(p)
plt.xlim([47, 77])
plt.ylim([-47, -25])
where tract_list is a list of tracts which as you say you can obtain by a querying Object (distinct tractID). For some reason this finds whole tracts as I think skymap is everything rather than what’s just in DP0? You could probably refine the plot by also querying for distinct tractID,patch and then filtering on patch as well as tract.