I was wondering if there is a way to visualize images within the RSP using typical “DS9-like” features (e.g., setting colors, scales, etc.)
As far as I know, the colorbar scaling algorithm can be controlled with something like this: display.scale("stetch", "scale").
However, I can only choose "stretch"=linear,asinh and "scale"=zscale,minmax or arbitrary minimum (black) and maximum (white) values.
Are there other possibilities?
Is there a way to use a colorbar different than the default grey-scale?
VIncenzo, I’m not entirely clear on what you’re asking for, specifically (e.g., do you need Python code, or would a GUI control work?). Image display was covered in the Aug 5 Delegate Assembly; there’s a summary with video links here:
In the 1st video, around 55:30, Jeff Carlin shows how to change the colormap in Firefly image displays (using the color palette tool). Perhaps that will help.
Thank you Tom!
I was trying to do it through python code and using matplotlib as backend. This seemed to be the fastest way to produce images embedded in the notebook or highlight something on them.
Either way, perhaps Firefly offers easier-to-apply customizations.
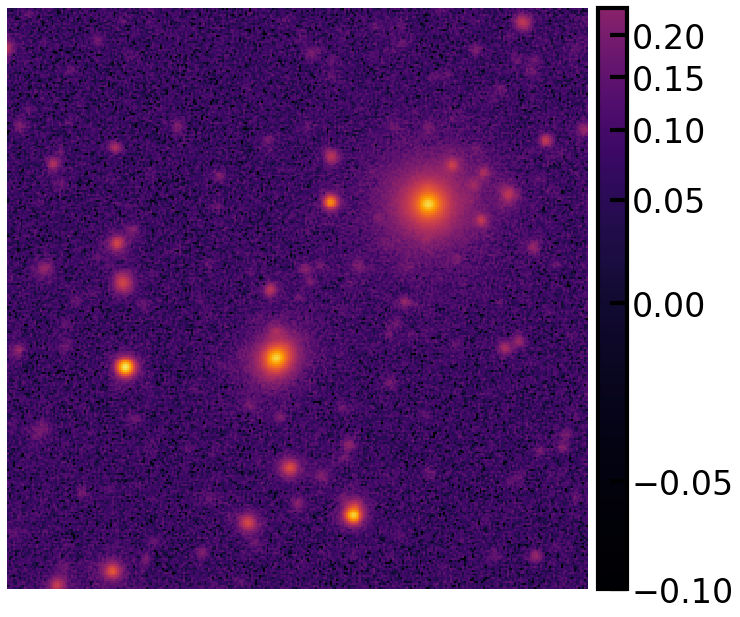
I found a way to change the colorbar with matplotlib as backend while I was working with @nandinihazra.
I will report the answer here as it is related to my initial question and may be useful for other people in this Community.
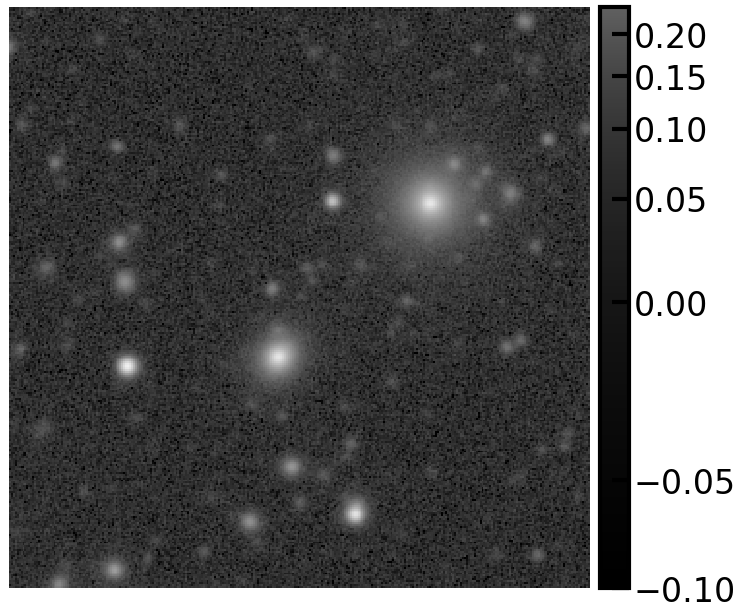
The default color map is grey-scale. It can be changed by modifing lsst.afwDisplay.Display.setDefaultImageColormap before lo load the image: Display — LSST Science Pipelines