I was too quick to conclude this was working…it seems like there are still a few tasks failing and causing an out-of-memory error. Actually, I am not sure I understand the behavior of the stack given how I am seeing tasks are fail/succeed.
To preface, when I say out-of-memory error I mean the Slurm scheduler issues to me a message like:
slurmstepd: error: Detected 624407 oom-kill event(s) in StepId=2658029.0 cgroup. Some of your processes may have been killed by the cgroup out-of-memory handler.
srun: error: n2244: task 0: Out Of Memory
followed by me being kicked off of the node. When this happens, I see one to many core.<n> file(s) created on disk – I think these contain (some of?) the memory content of the process for debugging and <n> is likely the process id. I’ll call these “explicit” out-of-memory events.
I have also seen the core files being created when no message is issued to me from Slurm (or I somehow missed it) and I am not kicked off of my node. These I’ll call “inferred” out-of-memory events.
On my first run of the ApTemplate.yaml, which contains four tasks:
lsst.pipe.tasks.postprocess.ConsolidateVisitSummaryTasklsst.pipe.tasks.selectImages.BestSeeingQuantileSelectVisitsTasklsst.pipe.tasks.makeCoaddTempExp.MakeWarpTasklsst.pipe.tasks.assembleCoadd.CompareWarpAssembleCoaddTask
32/32918 quanta for these four tasks failed. It seems these were mostly MakeWarpTask from the logs:
lsst.ctrl.mpexec.mpGraphExecutor ERROR: Task <TaskDef(MakeWarpTask, label=makeWarp) dataId={instrument: 'DECam', skymap: 'discrete', tract: 0, patch: 48, visit: 984937, ...}> failed; processing will continue for remaining tasks.
lsst.ctrl.mpexec.mpGraphExecutor ERROR: Upstream job failed for task <TaskDef(CompareWarpAssembleCoaddTask, label=assembleCoadd) dataId={band: 'g', skymap: 'discrete', tract: 0, patch: 48}>, skipping this task.
I’m not sure if I saw core files for this run.
I then re-ran the pipeline with --skip-existing --extend-run --clobber-outputs to extend the run, skip existing completed quanta, and retry failed tasks. On the second run, 15/32 quanta are reported completed (actually 19/32 based on how many quanta needed to be completed in subsequent runs – there are 13 left) before the processes mysteriously stopped running. There are no errors in the logs. The last log message is:
lsst.ctrl.mpexec.singleQuantumExecutor INFO: Execution of task 'assembleCoadd' on quantum {band: 'r', skymap: 'discrete', tract: 0, patch: 65} took 2105.945 seconds
I saw some core files for this run, but was not kicked off i.e. “inferred out-of-memory”.
I re-ran again, thinking that since a few tasks are succeeding each time, I can just iteratively re-start and it will eventually succeed. This time, there are no reported successful tasks in the logs, but I can infer that 3/13 succeeded (there are 10 left) based on subsequent runs, and the processing stopped as before without errors. The last line in the logs is:
lsst.ctrl.mpexec.singleQuantumExecutor INFO: Execution of task 'assembleCoadd' on quantum {band: 'g', skymap: 'discrete', tract: 0, patch: 66} took 1980.689 seconds
I saw core files for this run, but was not kicked off i.e. “inferred out-of-memory”.
I re-ran again, this time with -j 1 to spawn just one process thinking that I was hitting out of memory errors again and having just one process requiring memory would fix it. This time 6/10 quanta completed before processing stopped. The last lines of the log are:
lsst.ctrl.mpexec.mpGraphExecutor INFO: Executed 6 quanta successfully, 0 failed and 4 remain out of total 10 quanta.
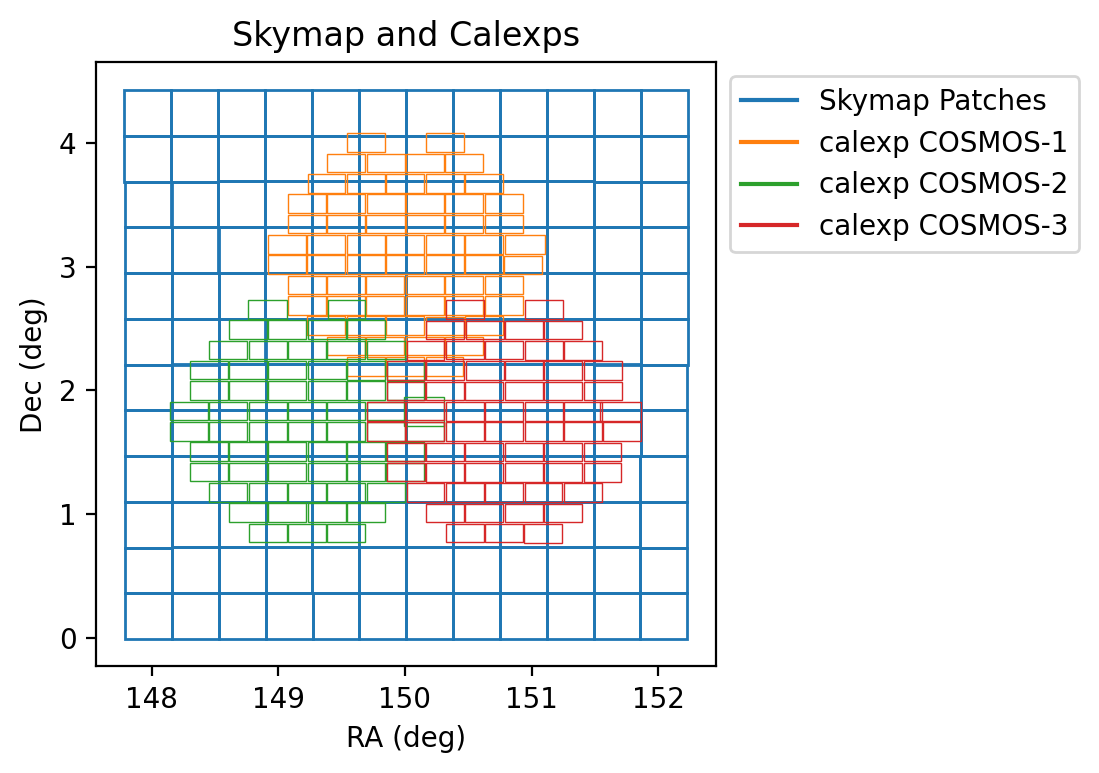
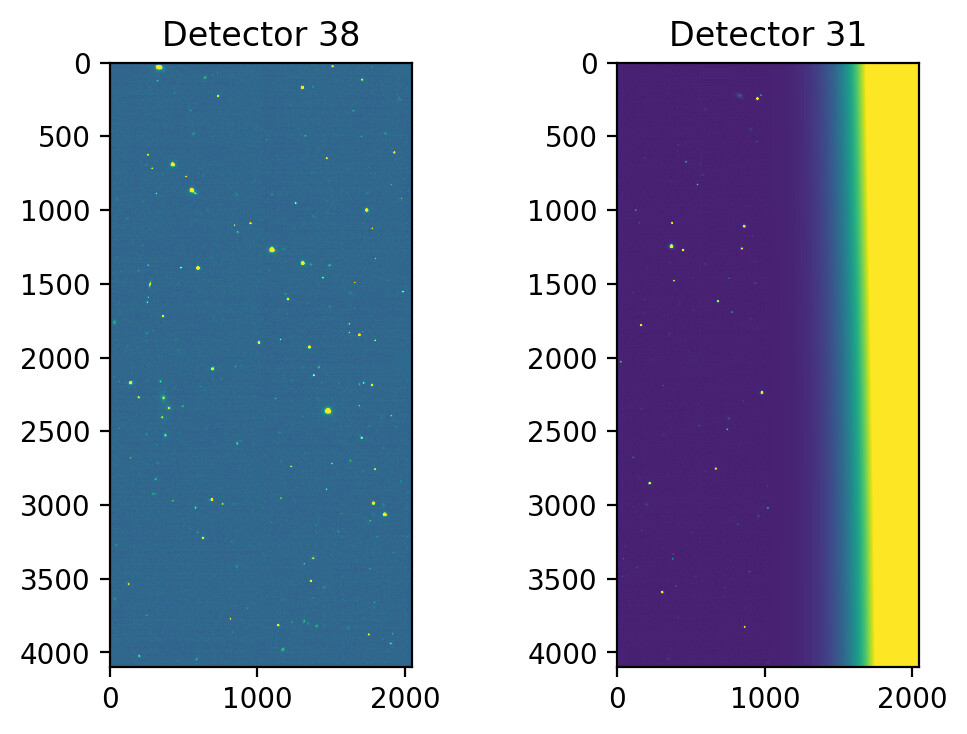
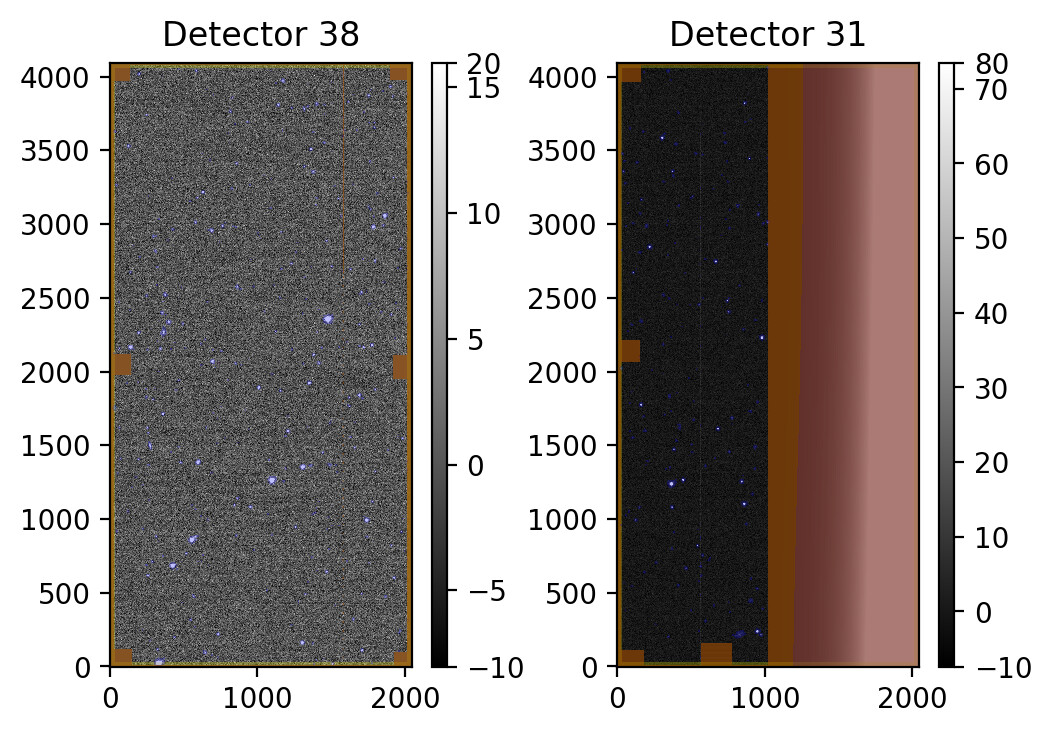
lsst.makeWarp.select INFO: Selecting calexp {instrument: 'DECam', detector: 31, visit: 984937, ...}
lsst.makeWarp.select INFO: Selecting calexp {instrument: 'DECam', detector: 38, visit: 984937, ...}
lsst.makeWarp INFO: Processing calexp 1 of 2 for this Warp: id={instrument: 'DECam', detector: 31, visit: 984937, ...}
lsst.makeWarp.warpAndPsfMatch.psfMatch INFO: compute Psf-matching kernel
py.warnings WARNING: /gscratch/astro/stevengs/lsst_stacks/stacks/w.2022.06/stack/miniconda3-py38_4.9.2-1.0.0/Linux64/ip_diffim/g5706f010af+0869991ead/python/lsst/ip/diffim/modelPsfMatch.py:419: FutureWarning: Default position argument overload is deprecated and will be removed in version 24.0. Please explicitly specify a position.
dimenR = referencePsfModel.getLocalKernel().getDimensions()
lsst.makeWarp.warpAndPsfMatch.psfMatch INFO: Adjusted dimensions of reference PSF model from (9, 9) to (12373, 12373)
lsst.ip.diffim.generateAlardLuptonBasisList INFO: PSF sigmas are not available or scaling by fwhm disabled, falling back to config values
I saw core files for this run, but was not kicked off i.e. “inferred out-of-memory”.
Finally, I ran again with -j 1 and found no quanta completed and the very first task failed with an “explicit out-of-memory error” after I saw the memory usage spike above 220GB. The only lines from the logs are:
lsst.ctrl.mpexec.cmdLineFwk INFO: QuantumGraph contains 4 quanta for 4 tasks, graph ID: '1647645520.2195563-14080'
conda.common.io INFO: overtaking stderr and stdout
conda.common.io INFO: stderr and stdout yielding back
lsst.makeWarp.select INFO: Selecting calexp {instrument: 'DECam', detector: 31, visit: 984937, ...}
lsst.makeWarp.select INFO: Selecting calexp {instrument: 'DECam', detector: 38, visit: 984937, ...}
lsst.makeWarp INFO: Processing calexp 1 of 2 for this Warp: id={instrument: 'DECam', detector: 31, visit: 984937, ...}
lsst.makeWarp.warpAndPsfMatch.psfMatch INFO: compute Psf-matching kernel
py.warnings WARNING: /gscratch/astro/stevengs/lsst_stacks/stacks/w.2022.06/stack/miniconda3-py38_4.9.2-1.0.0/Linux64/ip_diffim/g5706f010af+0869991ead/python/lsst/ip/diffim/modelPsfMatch.py:419: FutureWarning: Default position argument overload is deprecated and will be removed in version 24.0.  Please explicitly specify a position.
  dimenR = referencePsfModel.getLocalKernel().getDimensions()

lsst.makeWarp.warpAndPsfMatch.psfMatch INFO: Adjusted dimensions of reference PSF model from (9, 9) to (12373, 12373)
lsst.ip.diffim.generateAlardLuptonBasisList INFO: PSF sigmas are not available or scaling by fwhm disabled, falling back to config values
Long story made short: it seems to me that there are just a few tasks that have a very high memory footprint. I include all of the details just to offer more information about what these failures/out-of-memory events look like and why they are mysterious to me. For example, why do some tasks fail on the first run but succeed on subsequent runs? And why are some task failures explicit (show up with an error message in the log) and sometimes the processing fails quietly?
And finally the question: can I tune subregionSize to a different (smaller?) value to further decrease the memory footprint?
Thanks,
Steven