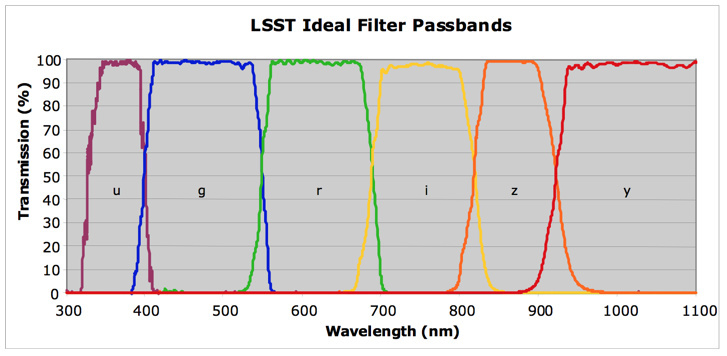
LSST filter profiles

Hi all, I got a request from the SVO filter profile service to provide them with LSST bandpass transmission functions so they can add them to their master list. While a figure in the LSST camera design paper from 2008 (shown below) seems to show the profiles, I couldn’t find these curves anywhere online in machine-readable form.

I am interested in using the transmission curves for some projects and I imagine a lot on this forum are interested in this too. Please feel free to tell me I’ve missed an obvious link somewhere.

There is another filter profile service around:
http://voservices.net/filter/default.aspx
that seems to be a survivor of the NVO.

I’ll answer my own question, the profiles appear to be here (thanks @crb): https://github.com/lsst/throughputs/tree/master/baseline

Correct me if I’m wrong though!

There is also


which is where I would have looked.

I don’t know what the relationship between the two is.

The two distributions are likely identical (one is source for the other) but I am
re-checking this with the authors. If they are not identical, I will post more
details.

Yes, they should be identical. They currently are (and this can be checked by looking at the tagged #'s in the throughputs files headers, which trace to the syseng_throughputs repo version that they were created from).

lsst-pst/syseng_throughputs is the authoritative source, but lsst/throughputs existed first and has thus continued to exist as (a) it matches the format for the throughput curves expected by all of the sims code and (b) is already eups distributable / conda installable, etc.

Consistency in the SVO “filter” profiles seems to be poor, or I might be misunderstanding something.

Currently, DECam filters (found here) seem to be the actual filter responses, whereas the Pan-STARRS “filters” (found here) seem to include some portion of the atmospheric absorption, as evidenced by the notch around 750nm from the water vapor.

The current LSST filters (found here) seems to be for the whole system transmission, i.e. including the absorption from some nominal atmosphere and the detector QE , from the looks of things.

Am I missing something, or are they using different definitions for each telescope?

Also, are the LSST filter edges really (going to be) that shallow? I thought the edges were a lot sharper than that (as they seem to be for DECam).

@merlin You appear to be right, there’s some inconsistency. @crb, I’m guessing you intend the SVO to always have the response profiles sans the atmosphere?

I think that would be the sensible thing to do.

Just in case you’re not aware, it should be noted that LSST plans to correct for atmospheric absorption on a visit-by-visit basis (i.e. monitoring the actual atmospheric absorption profile at the time each observation is made), so including the absorption from some nominal atmosphere might be an odd thing to do.

It appears that the LSST filter curves were just uploaded to the SVO in the last day. They weren’t there yesterday. So I assume they were taken from the information @ljones posted. The provenance provided is just a link to https://github.com/lsst/throughputs/tree/master/baseline , which is consistent with that, but it doesn’t point to a specific version of a specific file, which would be preferable. Beyond that there seems to be no other provenance information (e.g., no upload userid or date) in the SVO data, which I think is a shame.

All valid criticisms @gpdf, but I think @crb is responsive to constructive suggestion on how to improve their page. I’ve pinged him on this thread so he can look at everyone’s suggestions.

Hi.

The fact is that each telescope team give the filter responses that they give. They are not always easy to find, and in many cases, they give very little information about them.

In general, we give the curves that we find.

Actually our ultimate goal is to provide the best curves, in each case, that can be used to generate synthetic photometry for theoretical models so that it can be compared to observed photometry.

One of the first set of filters that we included, years ago, in the service, was the one for 2mass survey, and they give the “official” curves including some average atmosphere.
That makes me think that it is better to have curves including everything (atmosphere too) when they are available and, otherwise, the best approximation available to the bandpass.

We are preparing a new version of the Filter Profile Service with two ideas in mind: (1) giving more information about what components are included in the curve, if the information is available (which fits very well this conversation) and (2) organize calibration information in a better way.

I really will appreciate very much any comment or suggestion about what you would like to find in such a service so that we can improve it as much as possible.

In what respect to atmosphere, I understand that every observatory does what @merlin comments. And they will also have zero points for each night. But at the end, they provide a final catalogue with just magnitudes, and some average zero points for the catalogue. In that case, to analyze those measures (for instance, to calculate equivalent synthetic photometry), what is better? having the transmission including some average atmosphere or without it?

@gpdf is right, and it seems a good idea. We actually keep the information about when the curves where uploaded, when some change has been made and so. So we could perfectly include that information. We’ll do in next version. Thanks for the comment (about user id, we have the information too, but it is always me :wink:

And yes, we uploaded the curves yesterday. guillochon asked about them, we google for them, found them and included them in the service. And, by the way, calculated synthetic photometry for ~40 collections of theoretical models.

That’s the way it usually happens. We often discover new instruments and filters because somebody asks for them and improve things because someone asks for new features or give constructive criticism, suggestions or whatever :slight_smile:

@crb One thing that’s a bit odd to me is that the transmission values for the LSST bands on the SVO page are about 20%, whereas most of the other instruments on SVO are >80%, which I’m guessing means the total_*.dat files from https://github.com/lsst/throughputs/tree/master/baseline were imported. I would think the filter_*.dat files are the ones that should be used, but I am not sure… @gpdf/@merlin?

Hi @merlin, about the edges – basically, there was a study about the filter profiles done for the PST (before it was the PST), including the sharpness/taper of the edges. While it’s a gamble on baby sleep deprivation, IF I am remembering correctly, some amount of taper is desirable for photo-z to guarantee the filters meet near the edges (after potential manufacturing errors and filter shifts as a function of radius). The resulting filter specifications are based on that desired amount of taper.

Whether you should use the total_*dat or filter_*dat files depends on what else you include. Myself, I think you should use the total_*.dat files and include everything that LSST expects (this includes atmosphere, sensor QE, and optics including filter profiles). And you should do the same for other surveys.

You could then provide to users the AB magnitude above the atmosphere, and a SNR expected for a given exposure time. Alternatively, you could provide the AB magnitudes as measured in the image and an instrumental zeropoint, again for a given exposure time (in which case you would definitely need to include the atmosphere in your throughput curves). If you’re not including an expected exposure time, it seems to me that all magnitudes should be AB mags above the atmosphere, for all systems, and they will all be similar for different systems (although of course, the SNR/error would vary).

Typically surveys report a calibrated AB magnitude above the atmosphere in their catalogs.

Thanks Lynne, that’s interesting to know, I didn’t realise that was a design choice! :slight_smile:

I agree it would be great if the SVO service offered multiple profiles per filter/instrument combo that includes/excludes the atm, when available. It already offers different photometric systems, which is extremely useful. At the very least, the SVO should denote whether the filter is above/below the atm when that information is known.

For modelers, we model against whatever a survey reports, which is typically the above-atm value. This is currently the status quo, but I’m definitely in favor of a situation where the surveys report both the above/below atm outputs, and the modelers have access to the above/below atm profiles to reproduce the observations.