In last week’s Rubin Science Assembly, it was mentioned that alerts are anticipated to start in February and that alerts will be first produced using deep drilling field templates (DDF). It was also mentioned that additional templates are not anticipated before late March at the earliest. To help set expectations particularly as we move into the start of the LSST, would it be possible to get a sky map that is updated regularly with the available template sky coverage per filter? Perhaps something that could go on the survey progress website? The sky coverage plots/information isn’t necessarily helpful because it takes time to make and validate a template (plus likely certain image/observing conditions). So having a separate figure with the available sky coverage of the Year 1 incremental templates would be really helpful.
Hi @mschwamb, yes, this is on our roadmap. As described in RTN-011,
Expansion of the template area from DDF-only is not expected before the end of March 2026, at the earliest.
I marked Eric’s response as the solution, and have a few more comments.
It’s also my understanding that a sky map that is updated when new template area is added is in the works. It might appear on the survey progress page like you mention, but we also have a placeholder in the prompt products documentation that will be released soon (with the start of alerts). And this information wouldn’t be available just as an image, but as a list of coordinates (or sky regions), for programmatic access.
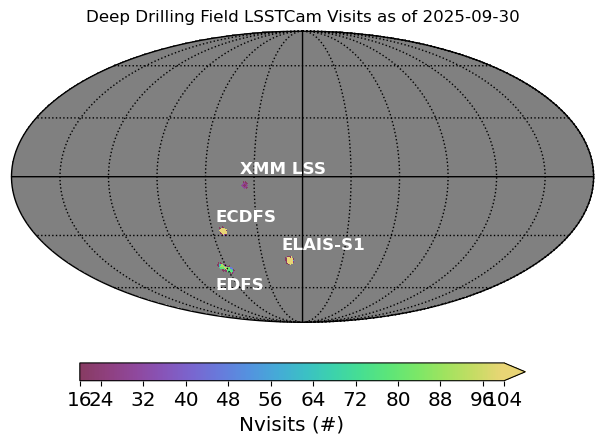
For a quick look, here’s the skymap that plots the number of visits (for all filters) as of 2025-09-30 in the Deep Drilling Fields. It was created with Commissioning notebook tutorial 101.
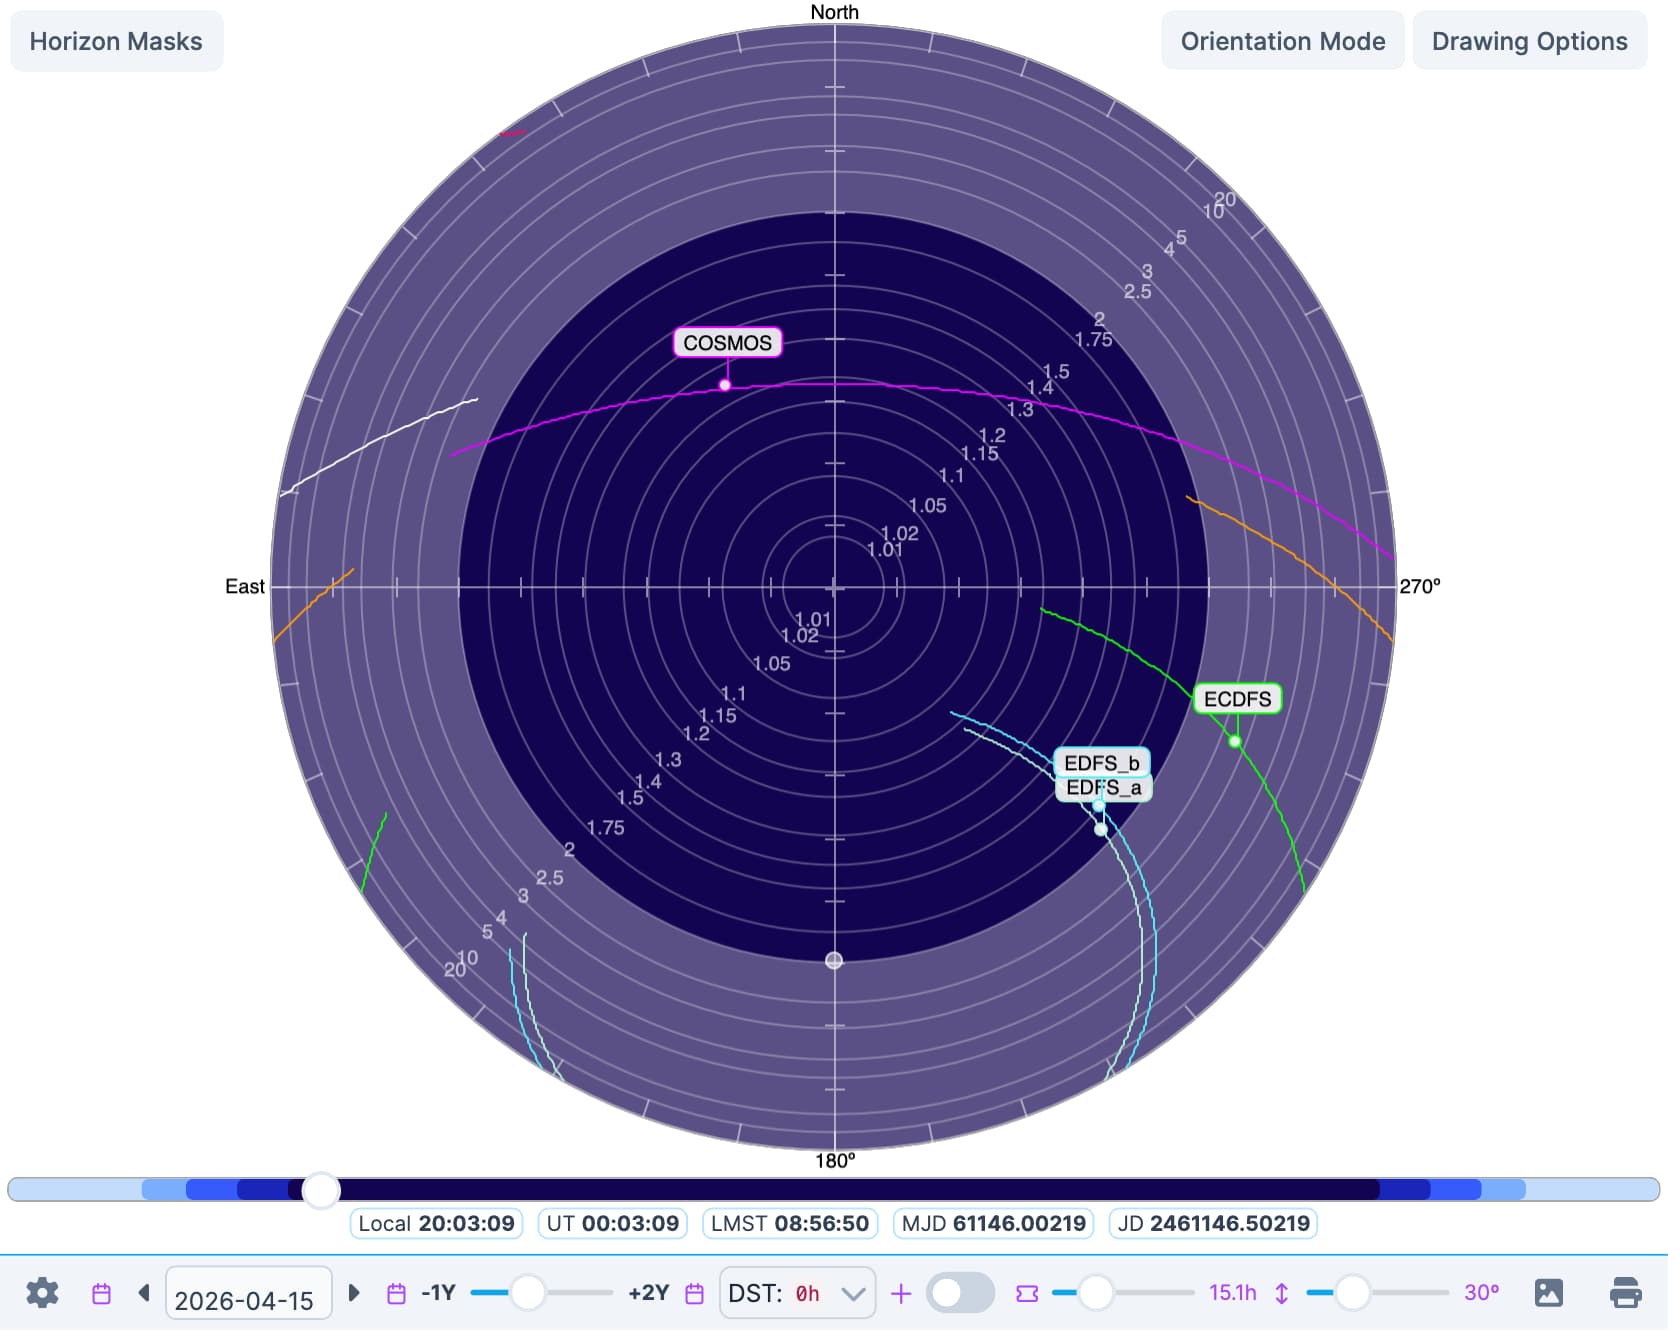
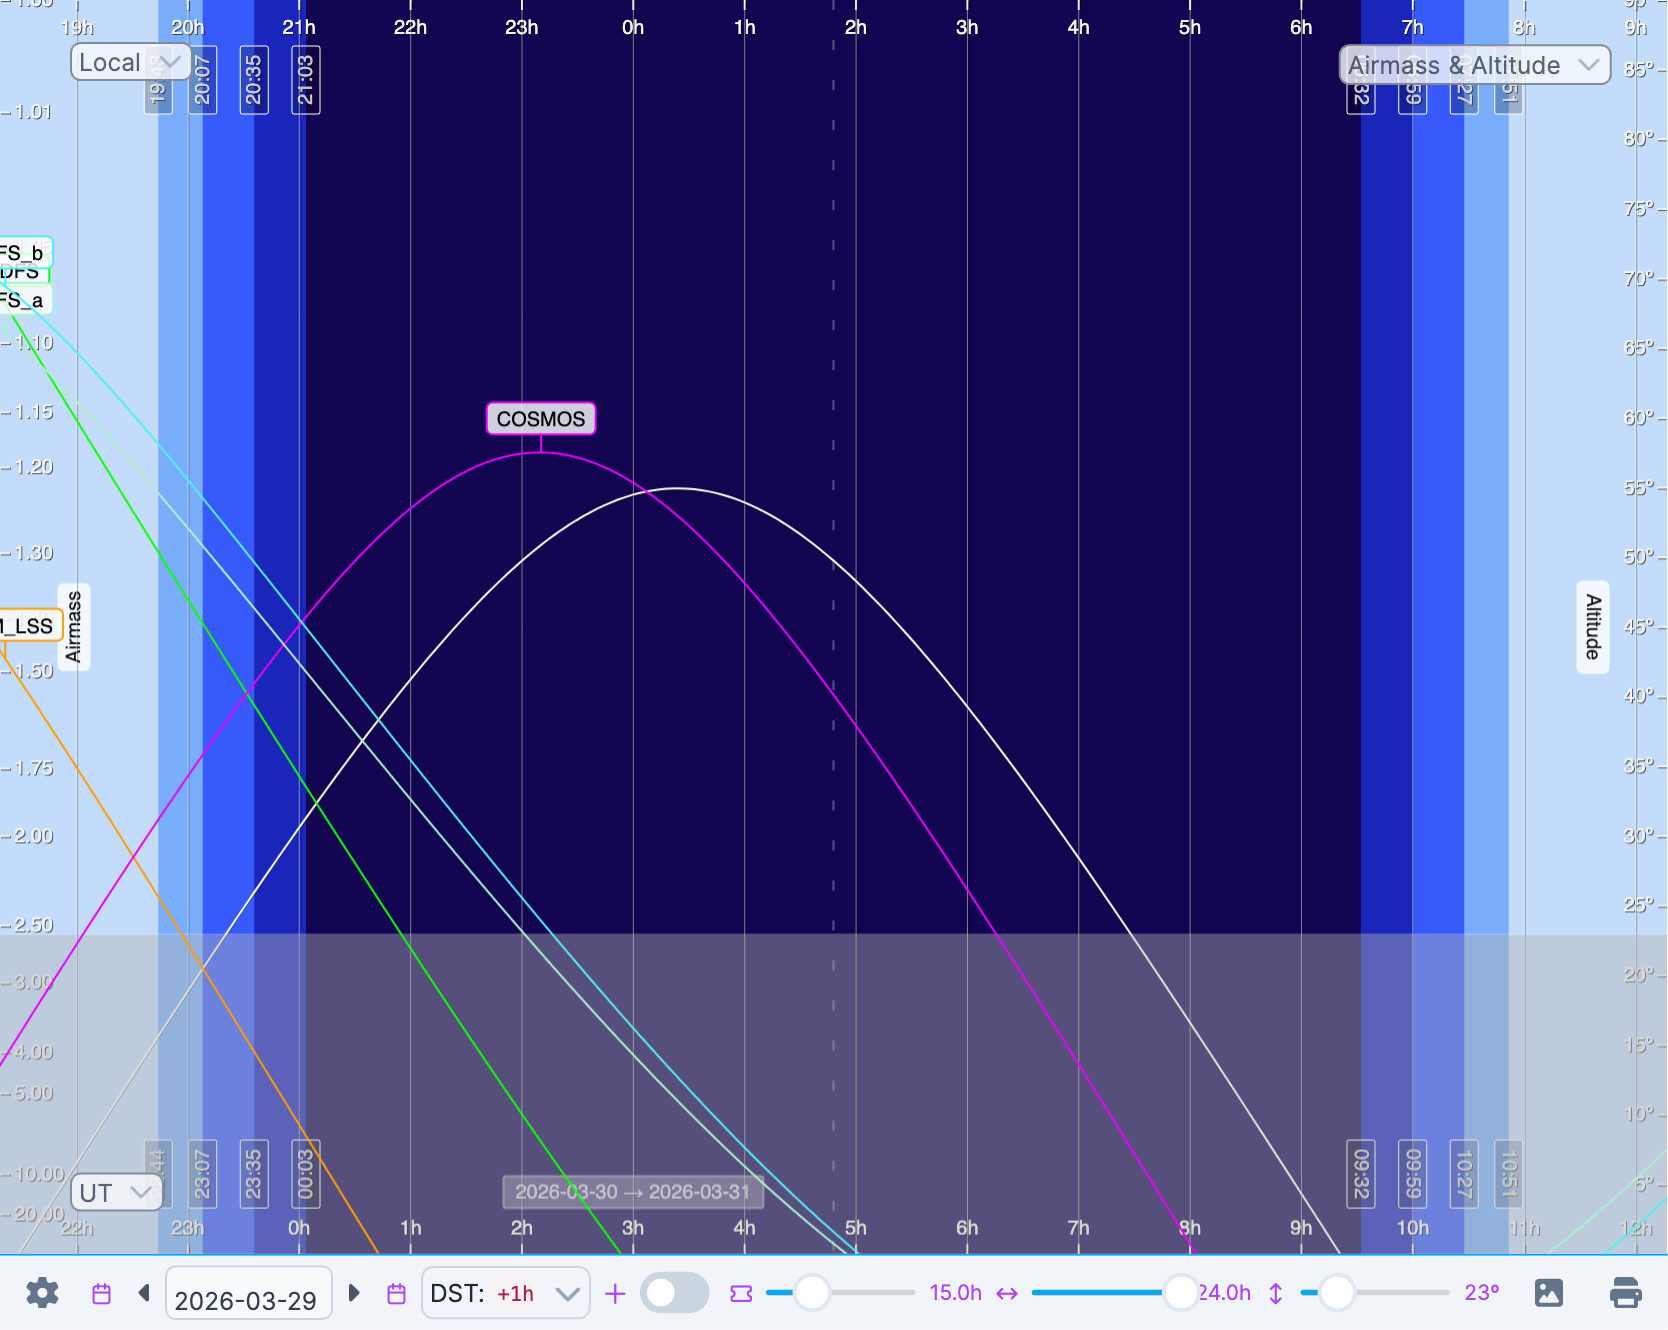
@MelissaGraham It’s great to hear that a tool is in the works. Are you saying there’s no templates available of the COSMOS field? Because that’s really the only DDF visible moving forward past the end of March. Here’s the az-airmass plot on-sky at the start of the night in mid-April.
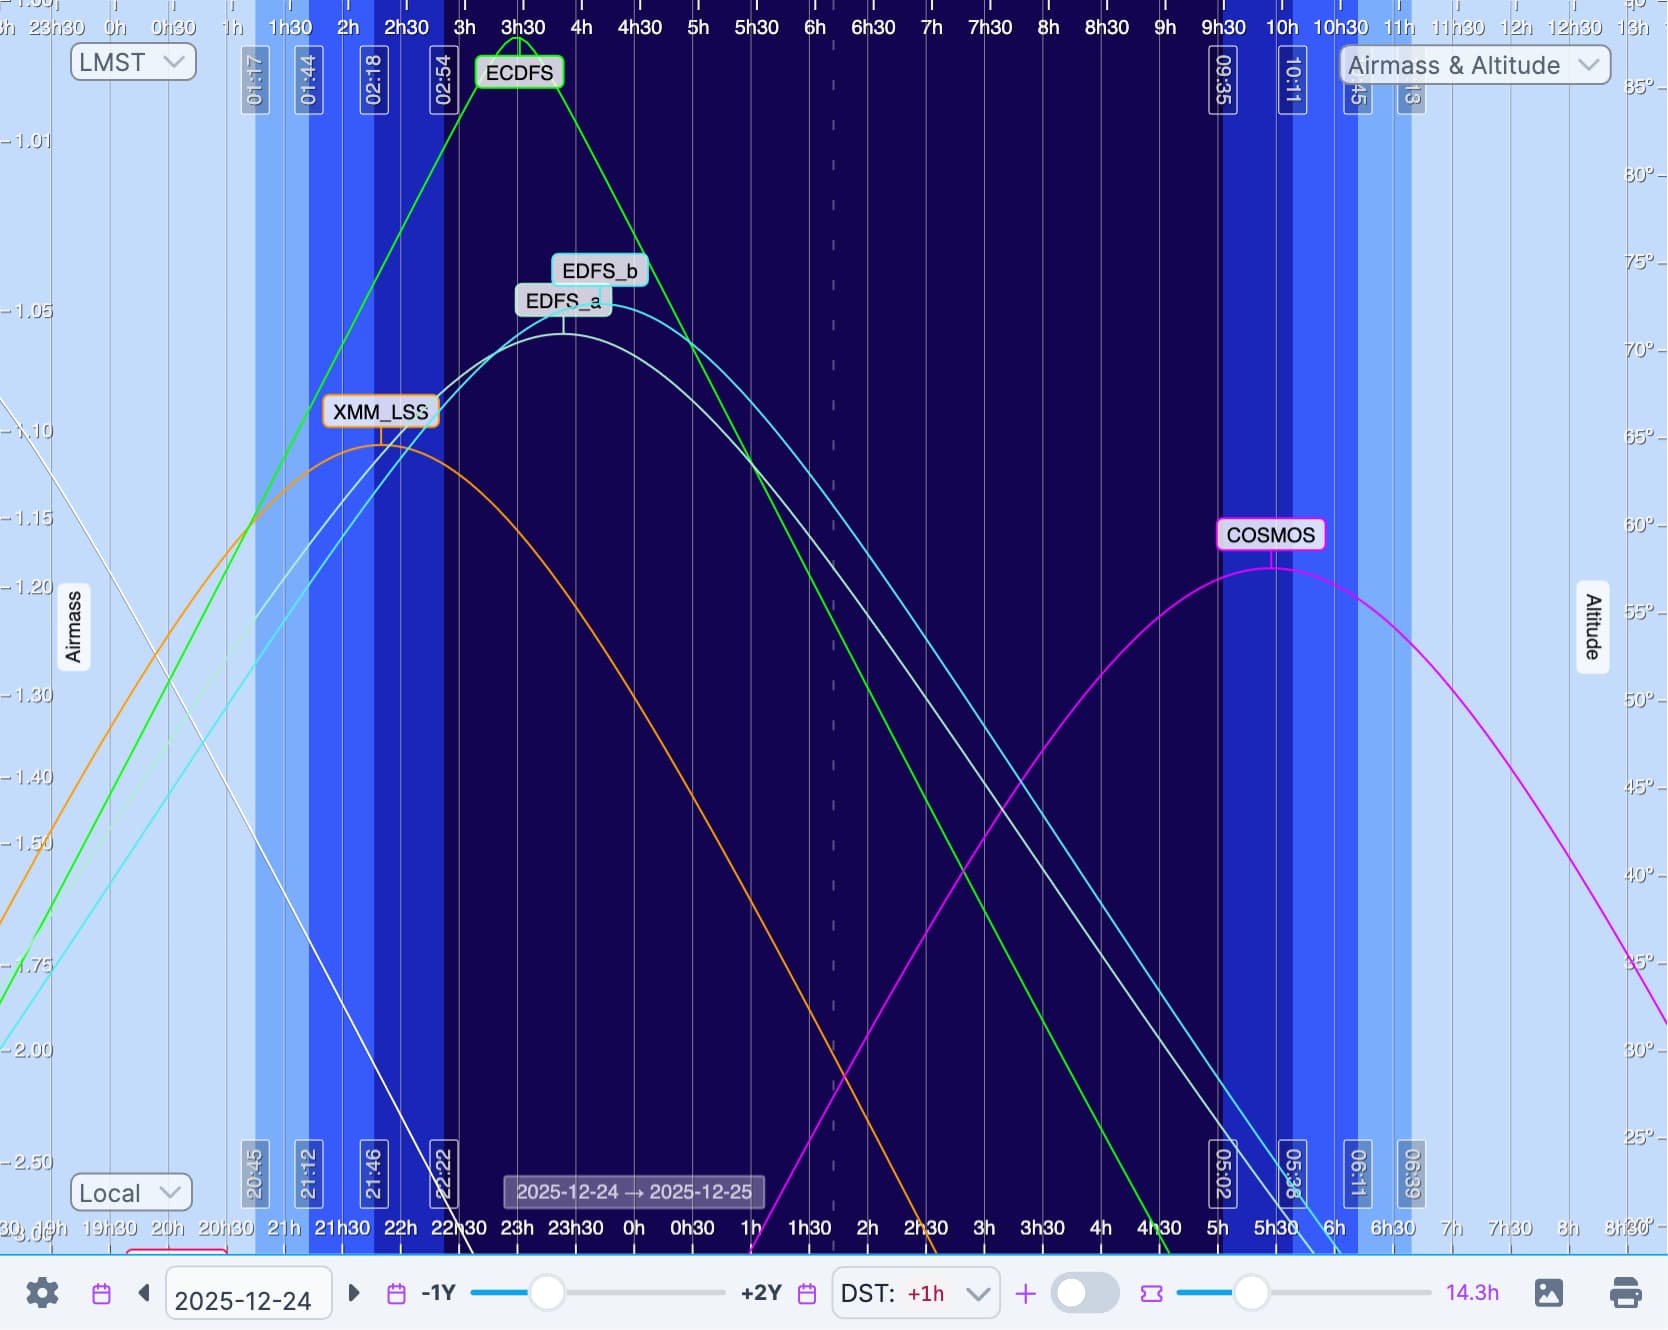
COSMOS is also the DDF that’s the closest to the ecliptic. It’s about 10 degrees from the ecliptic. The rest of the DDFs are further (XMM is next closest, but it’s nearly 18 degrees from the ecliptic. The bulk of asteroids and TNOs have inclinations less than 20 degrees).
Some clarity here would be helpful, whether it’s a plot or a list of DDFs and the filters where there are incremental templates already built for it. I appreciate a more comprehensive map/tool for showing incremental template coverage is being built, but there’s very little information being communicated and often confusing/slightly contradictory statements in various places about the start of alerts. In RTN-011 it says "The first Rubin alerts are currently expected to begin on February 4 2026, and will only use templates from the DDFs (which were observable through the end of 2025). "
COSMOS was observable in December so were observations to build successfully taken and the templates built?
So I ask because if COSMOS does not have templates than there will be little alerts that are Solar System objects which would be helpful for the planetary astronomy community to understand.
Yes that’s correct, images of COSMOS taken after 2025-09-30 have been used to generate templates of COSMOS, and AFAIK all of the Deep Drilling Fields have template images in at least one filter. I’ll be able to update the sky map when a more up-to-date list of LSSTCam visits has been released.
But based on Table 3 in RTN-011, these are the filters for which coadded images have been made for each field. Edit: added which of those filters templates had been created for as of today).
- XMM_LSS: u (no templates built yet)
- EDFS: griz (templates in griz)
- ECDFS: griz (templates in riz)
- ELAIS-S1: ugrizy (templates griz)
- COSMOS: ugrizy (templates in ugrizy)
Table 3 of RTN-011 isn’t 1-1 with the deployed templates. As of today, Prompt processing has deployed templates in
COSMOS - ugrizy
ECDFS - riz
ELAISS1 - griz
EDFS - griz
We are currently vetting updated templates for XMM-LSS and M49.
Thanks - this is very helpful to have this information