Thanks for the notebooks to parse the First Look Solar System detections reported to the Minor Planet Center (MPC). I’m finally get a chance to poke at the Solar System data products/released data while on the plane to the RCW.
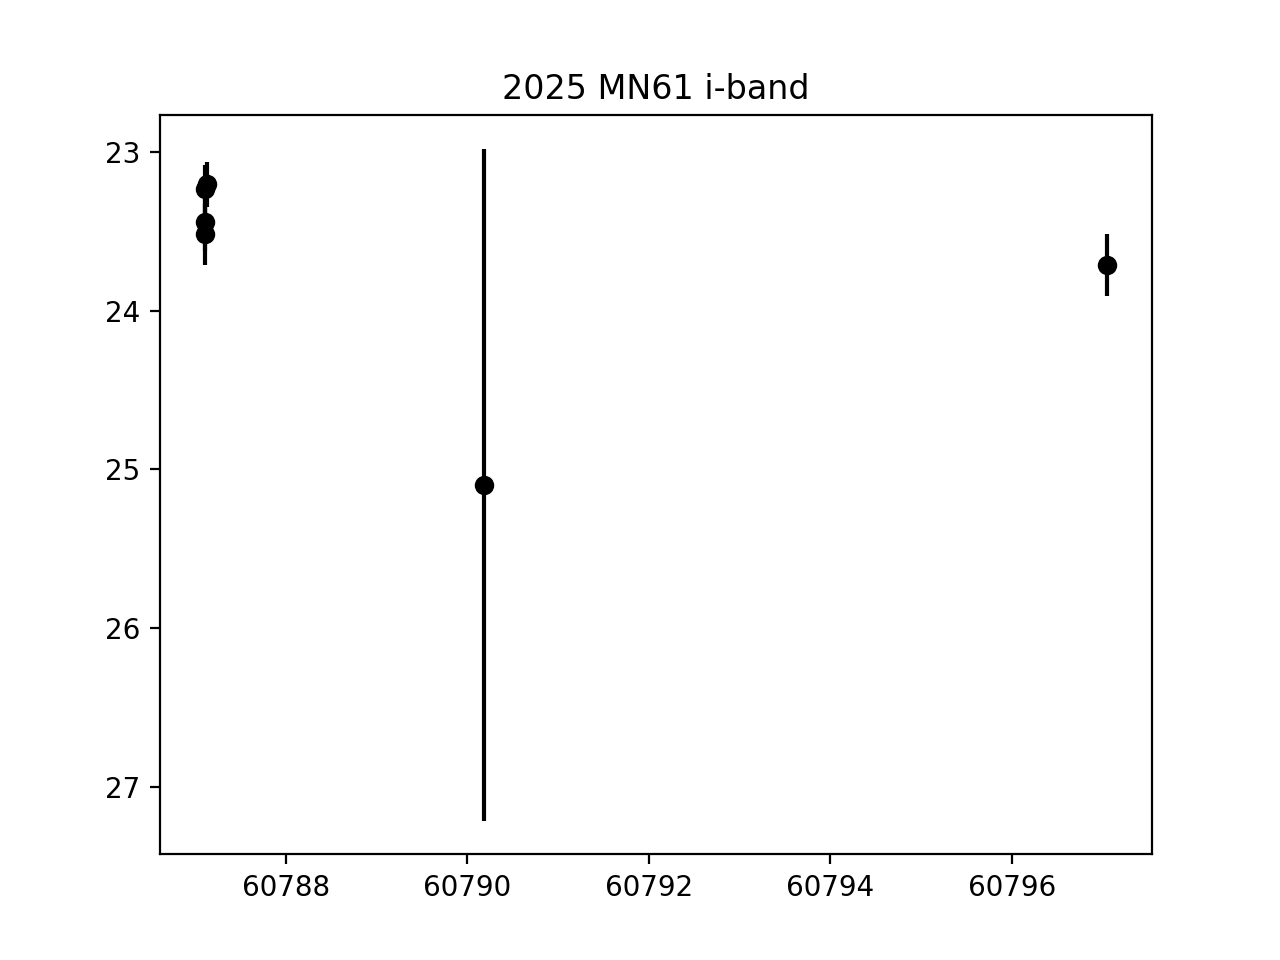
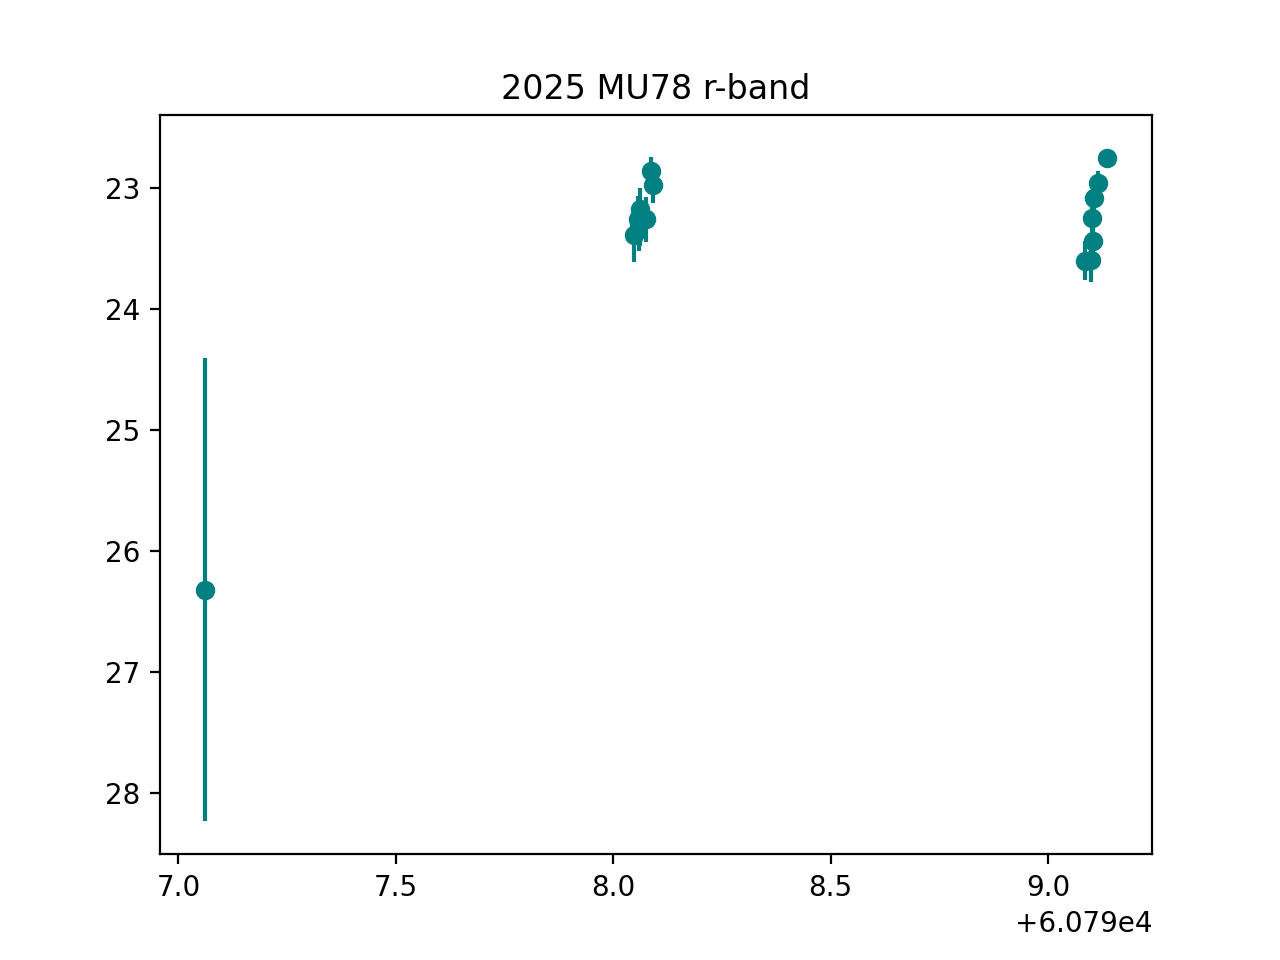
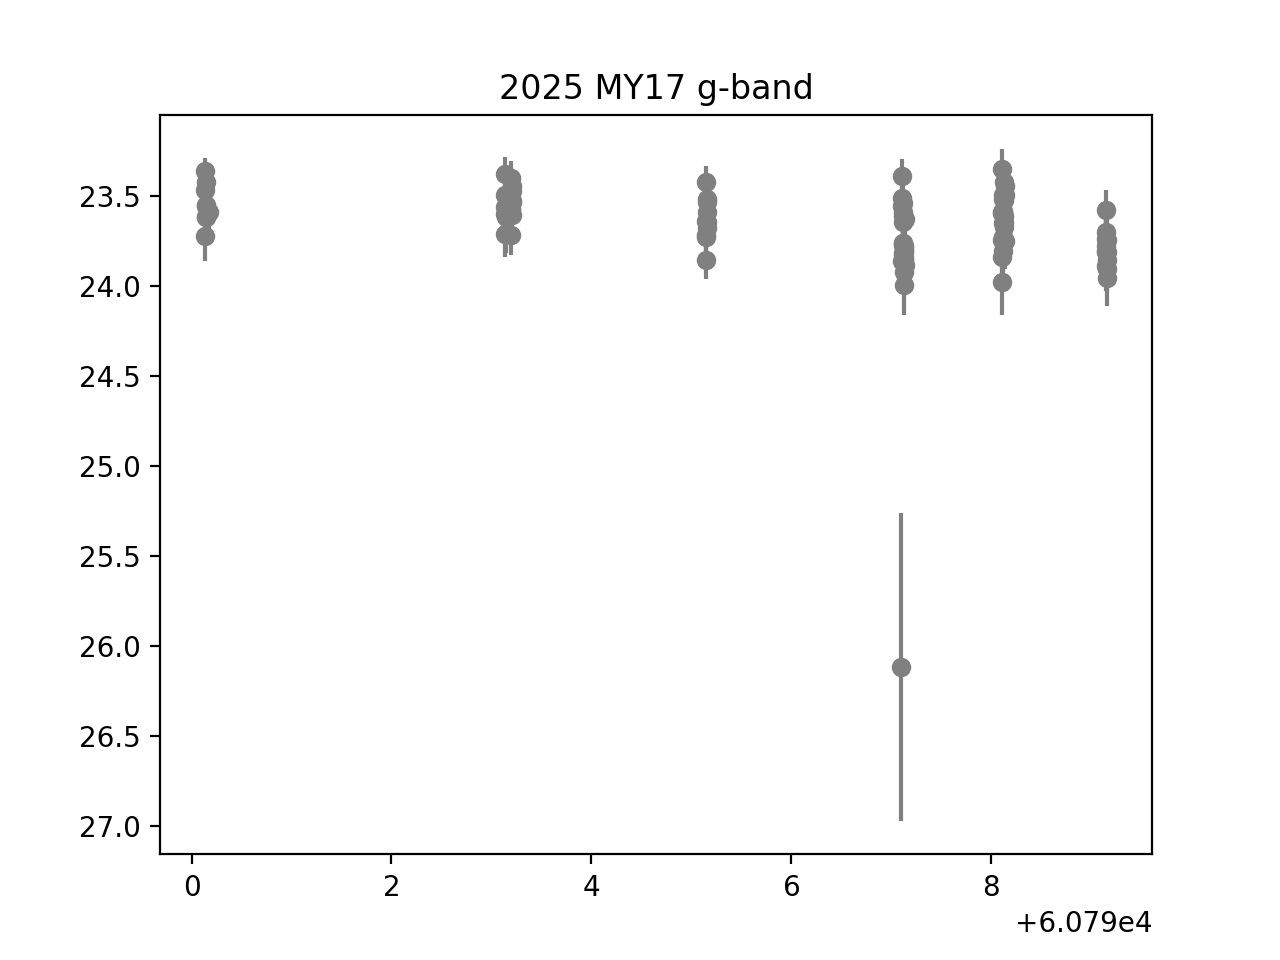
I think this likely a question for @mjuric . I’ve been parsing through the First LOOK MPC data. I’ve found a few very deviant photometric points with huge error bar (4 out of 343760 photometric measurements that jump out because they are well beyond the expected limiting magnitude). I was wondering if it’s known what happened with the observations? Bad observing conditions or something going on with the calibration? The photometric quality of this dataset is fantastic, so I’m really asking more out of curiosity because I would take a look at the images if this was in DP1.
Here’s all the apparent mags report in all filters (roughly characterized by orbit) in the First Look reported observations in a box/whisker.
Hi Meg, not sure if its related but I had been looking into this for DP1 and also noticed the occasional significantly outlying photometric measurement. Here’s a notebook with some examples.
Looks like most of the outliers had flags for dipoleFitAttempted and/or shape_flag. I also tried looking at the difference in apFlux, psfFlux, trailFlux and found that the aperture measurement had the greatest photometric outliers. I had started looking at a couple of these sources and they did appear to be slightly trailed and/or faint and fuzzy. So I wonder if this means that not all the flux is fully captured for these sources, especially for an aperture measurement?
I’m not 100% sure what’s up with these, but I’d start by looking at what the cutouts look for these in the RFL data and whether they’re close to artifacts (or instrumentally affected in some other way). That’s be my guess at what’s going on. I think this is not a SolSys-specific problem, but just general “how often will we get photometric outliers” type of thing. I can’t do it myself right now (we don’t have the tooling ready yet to make this easy), but I’ll put it on the TODO list.
Maybe someone on the image processing side of the DM house (or the CST) can take a look earlier?
Thanks, @mjuric. I’m not sure how I can look at these in the RFL data as all we have is the image viewer of the co-added observation and the video of Solar System discoveries. So whatever you can take a look is fine by me. I wanted to raise in case its an edge case that can be addressed for DP2 processing/prompt products processing. I agree it seems those data points are impacted by something and should be flagged in some way.
Thanks Meg for this question, James for the demo with DP1, and Mario for the suggestion to look at the images.
Unlike Data Preview 1 and all future data releases, the RFL photometry was released to the MPC without a full set of associated data products (e.g., flag parameters, observational metadata, images) with which to evaluate the quality of the observations, measurements, and calibrations.
Until the full release of Data Preview 2, to help users be aware of the outlier photometry in the MPC, we have added a Section 3.3 to the tutorial notebook that demonstrates how to access and visualize the RFL MPC photometry. It shows how to use the rmsmag as an error bar and that deviant photometry points can be excluded from analyses by imposing a restriction that rmsmag be < 0.25 mag. This tutorial is available in the Rubin Science Platform (RSP; in the menu bar of the Notebook Aspect click on “Tutorials” to see a drop down menu of all the tutorials).
To explore further, I took all of the observations reported to the MPC with an rmsmag > 0.25 mag (“photometric outliers”), and cross-matched their observation dates, times, and bands to the LSSTCam visit database. I examined the visit metadata, and found that the photometric outliers are not just from “bad” visits (e.g., poor seeing, cloud cover). There is also a tutorial that demonstrates how to access this visit database now available in the RSP.
I also looked at a subset of these “photometric outliers” in LSSTCam visit and difference images that were successfully processed in one of the Rubin Data Management team’s recent DP2 practice runs. I found that the sources associated with these photometric outliers were irregular in some way (very faint, extended, and in some cases a dipole). Based on this, I would anticipate that these sources would be accompanied by appropriate flags in the future data releases.
I’m going to mark this reply as the solution, but as always please don’t hesitate to reply in thread or open up new Support topics for new questions any time.