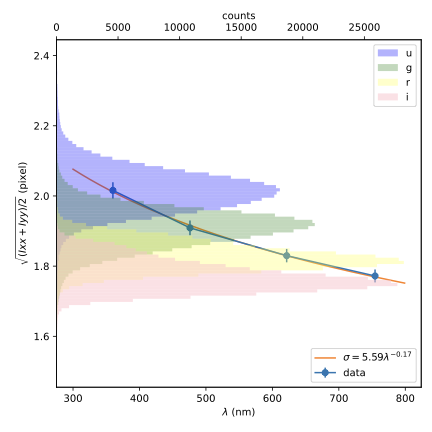
I want to share this plot about the chromatic effect on PSF size, with 300,000 dp01_dc2_catalogs stars in 18<mag_r<20. The average sizes of the PSF in four bands follow the power law as a function of the central wavelength of the bands (blue dot and orange curve). The histograms in the background show the size distributions.
I made this whole thing in <1 h, really shows how powerful the dp0 software is! I also want to appreciate the tutorials that the dm/dp0/dc2 team provide for us the science community. Thank you.
*Thanks Gregory Dubois-Felsmann for reproducing the plot with the portal system!
chromatic_overplot_fix.pdf (27.7 KB)
Tianqing