Portal query failing for cross match with uploaded catalog

Hi

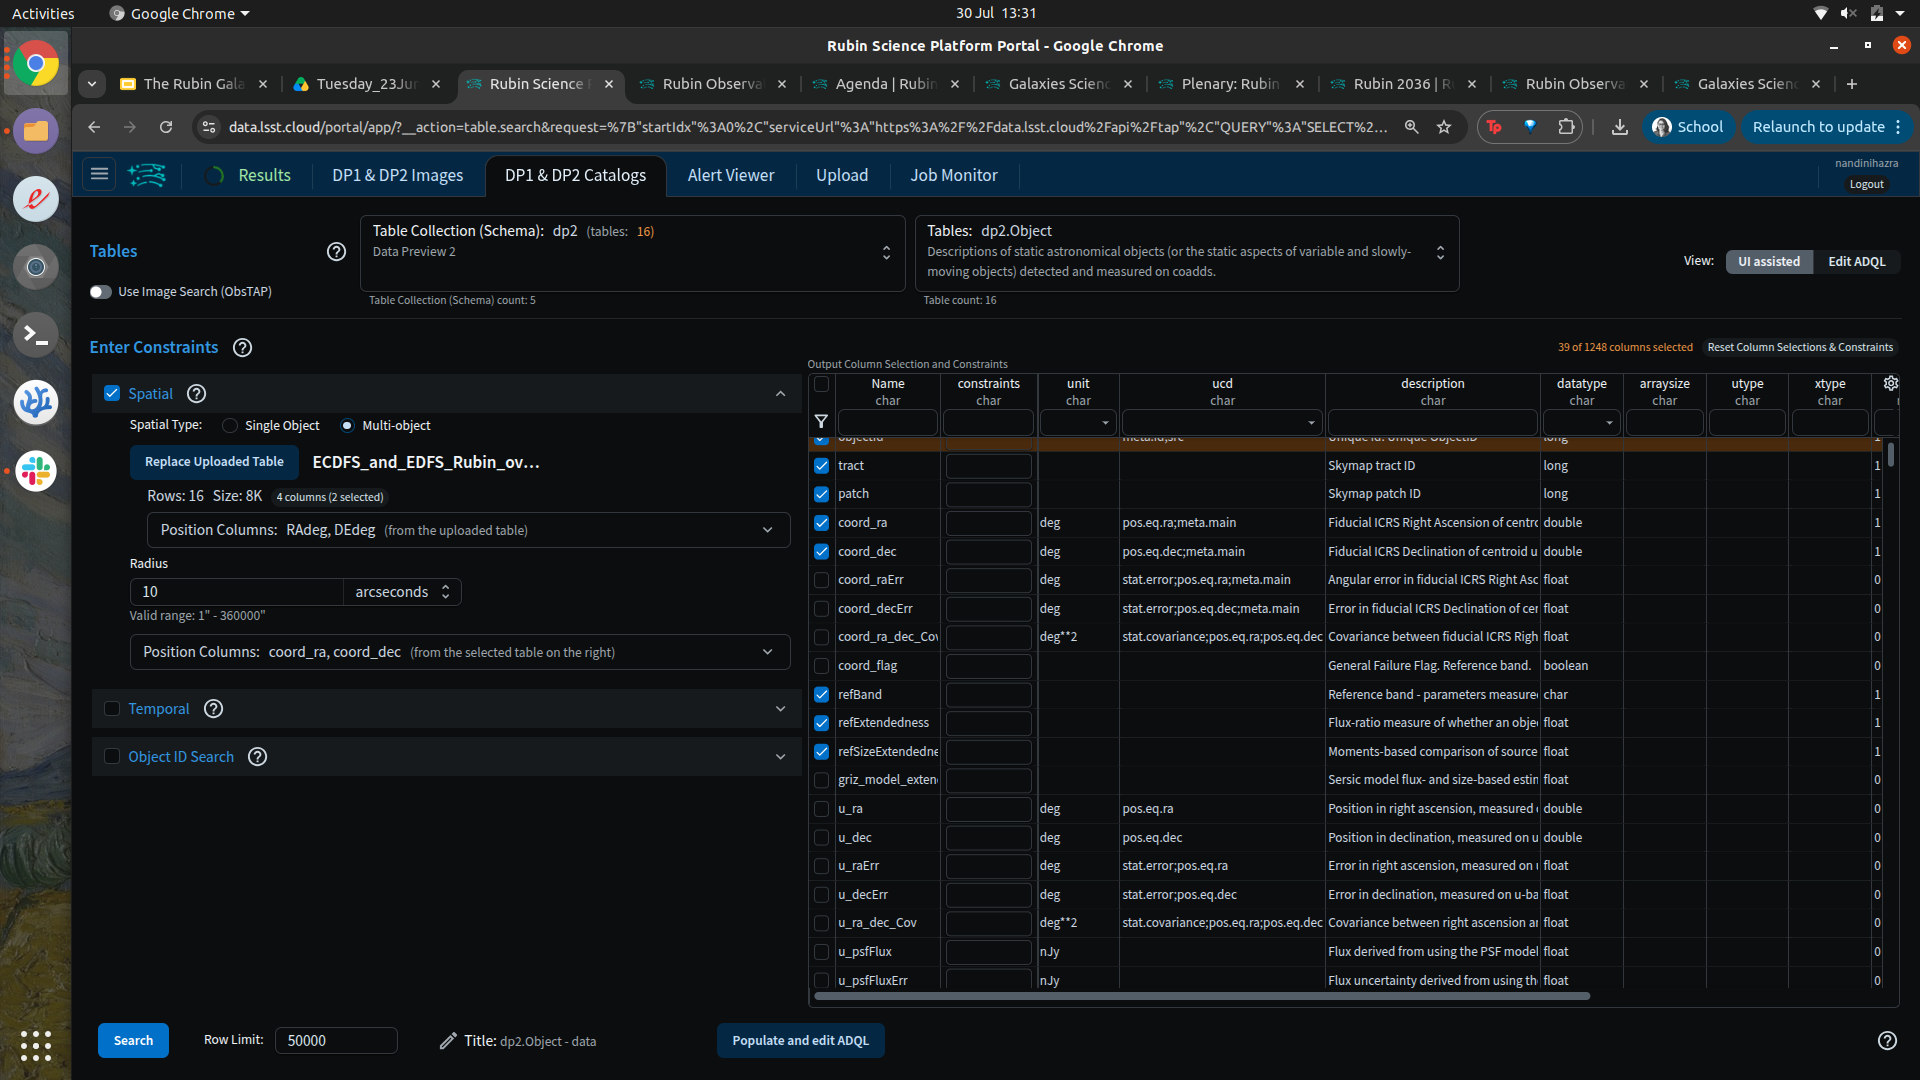
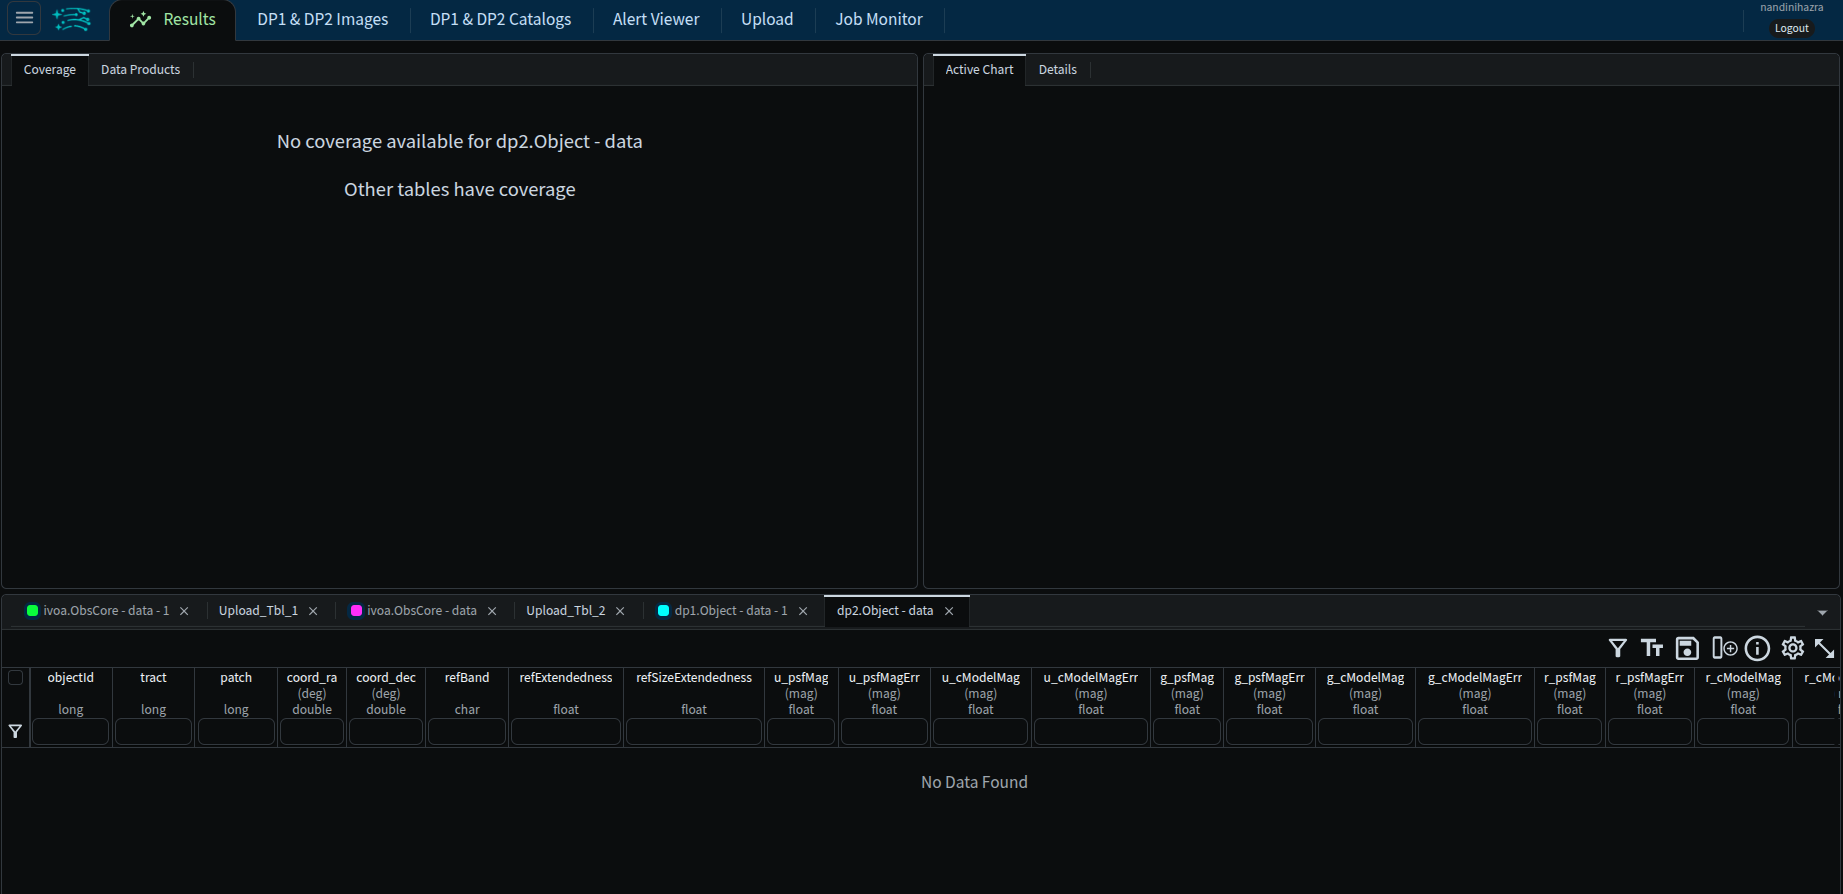
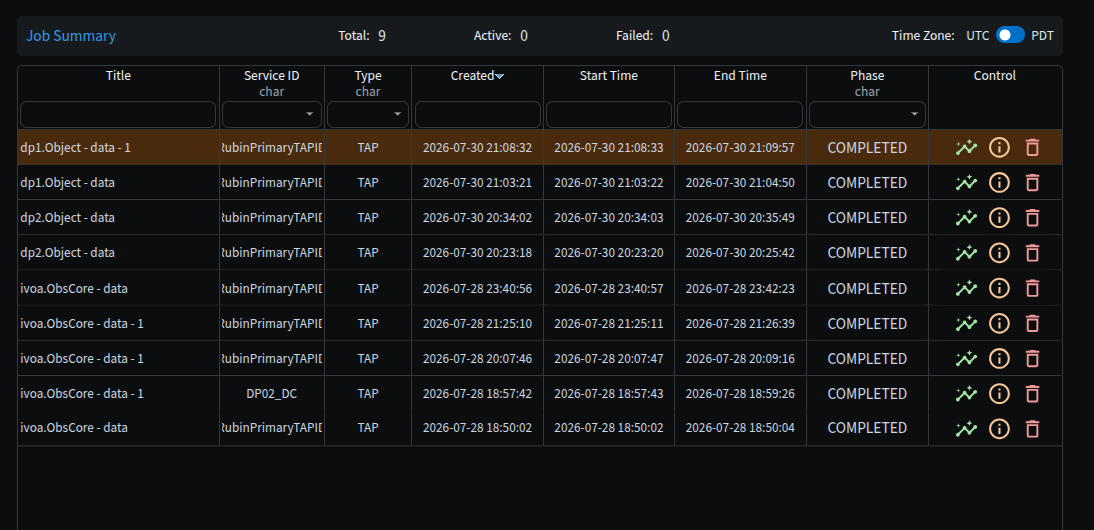
I have been trying to search for some ECDFS objects in DP2 using an uploaded catalog of 16 rows, and performing a cone search on the portal within 10 arcsec. The query has been failing since yesterday after trying ~4 times (there is no failure message, it just keeps going forever). I’m using DP2.Object table and I checked that the query does run all the way through successfully for someone else. I also tried running it on DP1.Object, which was also successful. I have attached some screenshots if that helps.

Thank you and best wishes
Nandini


My experience was that

  1. The first time I ran the query, at 2026-07-31T21:25:11.934Z, with the same file and settings as @nandinihazra , the job took ~3 minutes to complete and returned no results in the Results tab (It had just an empty table pane (1 pane, not the standard 3 pane view) and said “No Results” in the middle).

If I understand the pop-up window from the Job Monitor tab properly, this was the TAP query/job:

https://data.lsst.cloud/api/tap/async/iidanbldcr2wdppo

  1. The second time I ran the query, at 2026-07-30T21:32:06.421Z, it worked and populated the Results tab with and showed the expected 3-pane view: coadd viewer (upper left); 2D plot (RA, Dec) (upper right); and the table (below). Here’s the job/query information for that one:

https://data.lsst.cloud/api/tap/async/gx75cp11prw5rzmi

Thanks for the report, we’ll have a look in the morning to see what’s up.

Hi Nandini

I have checked the query history in Qserv for queries in which you were uploading temporary tables. I have found 4 queries. Please note that the names of your temporary tables in Qserv start with the prefix user_nandinihazra_. The rest of the name is some random string generated by the TAP service.

All your queries have succeeded. Here are the stats on each query:

Qserv queryId=156296

SELECT
  d.objectId, d.tract, d.patch, d.coord_ra, d.coord_dec, d.refBand, d.refExtendedness,
  d.refSizeExtendedness, d.u_psfMag, d.u_psfMagErr, d.u_cModelMag, d.u_cModelMagErr, 
  d.g_psfMag, d.g_psfMagErr, d.g_cModelMag, d.g_cModelMagErr, d.r_psfMag, d.r_psfMagErr, 
  d.r_cModelMag, d.r_cModelMagErr, d.i_psfMag, d.i_psfMagErr, d.i_cModelMag, d.i_cModelMagErr, 
  d.z_psfMag, d.z_psfMagErr, d.z_cModelMag, d.z_cModelMagErr, d.y_psfMag, d.y_psfMagErr, 
  d.y_cModelMag, d.y_cModelMagErr, d.parentObjectId, d.shape_xx, d.shape_yy, d.shape_xy, 
  d.detect_isIsolated, d.detect_fromBlend, d.deblend_parentNChild, ut.RAdeg, ut.DEdeg
FROM
  dp2.Object AS d, user_nandinihazra_p6db7qbd35h52pp6.upload_table AS ut
WHERE
  scisql_s2PtInCircle(d.coord_ra, d.coord_dec, ut.RAdeg, ut.DEdeg, 0.002777777777777778) = 1
LIMIT 50001

Query stats:

  • run time in Qserv: 21 sec
  • num rows in the result set: 201

Qserv queryId=156341

SELECT
  d.objectId, d.tract, d.patch, d.coord_ra, d.coord_dec, d.refBand, d.refExtendedness, d.refSizeExtendedness,
  d.u_psfMag, d.u_psfMagErr, d.u_cModelMag, d.u_cModelMagErr, d.g_psfMag, d.g_psfMagErr, d.g_cModelMag,
  d.g_cModelMagErr, d.r_psfMag, d.r_psfMagErr, d.r_cModelMag, d.r_cModelMagErr, d.i_psfMag, d.i_psfMagErr,
  d.i_cModelMag, d.i_cModelMagErr, d.z_psfMag, d.z_psfMagErr, d.z_cModelMag, d.z_cModelMagErr, d.y_psfMag,
  d.y_psfMagErr, d.y_cModelMag, d.y_cModelMagErr, d.parentObjectId, d.shape_xx, d.shape_yy, d.shape_xy,
  d.detect_isIsolated, d.detect_fromBlend, d.deblend_parentNChild, ut.RAdeg, ut.DEdeg
FROM
  dp2.Object AS d, user_nandinihazra_d1d4xbknzyd57ft9.upload_table AS ut
WHERE
  scisql_s2PtInCircle(d.coord_ra, d.coord_dec, ut.DEdeg, ut.RAdeg, 0.002777777777777778) = 1
LIMIT 50001

Query stats:

  • run time in Qserv: 21 sec
  • num rows in the result set: 0

Qserv queryId=156529

SELECT
  d.tract, d.patch, d.z_psfMag, d.z_psfMagErr, d.z_cModelMag, d.z_cModelMagErr, d.u_psfMag, d.u_psfMagErr,
  d.u_cModelMag, d.u_cModelMagErr, d.g_psfMag, d.g_psfMagErr, d.g_cModelMag, d.g_cModelMagErr,
  d.r_psfMag, d.r_psfMagErr, d.r_cModelMag, d.r_cModelMagErr, d.i_psfMag, d.i_psfMagErr, d.i_cModelMag,
  d.i_cModelMagErr, d.y_psfMag, d.y_psfMagErr, d.y_cModelMag, d.y_cModelMagErr, d.parentObjectId,
  d.coord_ra, d.coord_dec, d.refBand, d.refExtendedness, d.refSizeExtendedness, d.shape_xx, d.shape_yy,
  d.shape_xy, d.detect_isIsolated, d.detect_fromBlend, d.deblend_nChild, d.objectId, ut.RAdeg, ut.DEdeg
FROM
  dp1.Object AS d, user_nandinihazra_lzcejaot4fi4vr32.upload_table AS ut
WHERE
  scisql_s2PtInCircle(d.coord_ra, d.coord_dec, ut.DEdeg, ut.RAdeg, 0.002777777777777778) = 1
LIMIT 50001

Query stats:

  • run time in Qserv: 2 sec
  • num rows in the result set: 0

Qserv queryId=156562

SELECT
  d.tract, d.patch, d.z_psfMag, d.z_psfMagErr, d.z_cModelMag, d.z_cModelMagErr, d.u_psfMag, d.u_psfMagErr,
  d.u_cModelMag, d.u_cModelMagErr, d.g_psfMag, d.g_psfMagErr, d.g_cModelMag, d.g_cModelMagErr,
  d.r_psfMag, d.r_psfMagErr, d.r_cModelMag, d.r_cModelMagErr, d.i_psfMag, d.i_psfMagErr, d.i_cModelMag,
  d.i_cModelMagErr, d.y_psfMag, d.y_psfMagErr, d.y_cModelMag, d.y_cModelMagErr, d.parentObjectId,
  d.coord_ra, d.coord_dec, d.refBand, d.refExtendedness, d.refSizeExtendedness, d.shape_xx, d.shape_yy,
  d.shape_xy, d.detect_isIsolated, d.detect_fromBlend, d.deblend_nChild, d.objectId, ut.RAdeg, ut.DEdeg
FROM
  dp1.Object AS d, user_nandinihazra_awwys7kju5smwmsm.upload_table AS ut
WHERE
  scisql_s2PtInCircle(d.coord_ra, d.coord_dec, ut.RAdeg, ut.DEdeg, 0.0027777778) = 1
LIMIT 50001

Query stats:

  • run time in Qserv: 2 sec
  • num rows in the result set: 190

I’m not sure why you didn’t get the correct results on these 4 queries. There is a possibility that something unexpected happened in one of the upstream services/applications (TAP, or Portal).

Reagards,
Igor
What Igor means is “we are continuing to investigate” :slight_smile:

1 Like

Thanks @gapon and @frossie , When I check the Job Monitor I see the completed DP2 jobs listed there, but when I click on the “Show results” icon for one of them it takes me to the results tab where it says “No Results Found”. I have attached more screenshots.


Hi @nandinihazra thanks for the screenshots and the report, we’ve been tracing your queries through our backend logs for your recent jobs.

One thing we noticed is that in a couple of your DP1/DP2 crossmatch queries, the RA &Dec arguments in your cone search look like they might be swapped:
CONTAINS(POINT('ICRS', d.coord_ra, d.coord_dec), CIRCLE('ICRS', ut.DEdeg, ut.RAdeg, 0.0027777778)) = 1

Just checking, did you mean to pass dec before ra there, or should it be ut.RAdeg, ut.DEdeg (ra first, then dec)?
The two jobs that have these reversed did in fact return no results, and the “No Results Found” you see when navigating to the job you did would match what you would see if clicking one of those.

Could you try opening the results for the other jobs, in particular there is one with a job ID: p6db7qbd35h52pp6 which was a query to DP2 that succeeded and returned 201 rows.

You mentioned that the queries are failing (seemingly running forever), do you know approximately how long you waited for them to complete? Our records show that the queries returned within 80-115 seconds so is it possible that you navigated elsewhere before those were completed?

If not it is possible that you could have come across some bug in the portal that we are not aware of that would leave you with a job monitor spinning indefinitely.

If you are still experiencing this, would you be able to record a short screen capture of the whole flow, from submitting the query through watching the Job Monitor for one of the queries that seems to hang?
That would really help us see exactly what you’re seeing and compare it against what’s happening on the backend.

Thanks for your patience and for the help tracking this down.

1 Like

Thanks @stvoutsin I’ll try to answer piece by piece:

I was just trying to verify if my catalog file was written correctly and I swapped the columns to check that.

Thanks so much for this! I clicked through all the different results and found the ones which returned results, and those do display on the Results tab. I had just been trying to open one of the empty result queries earlier which did not work.

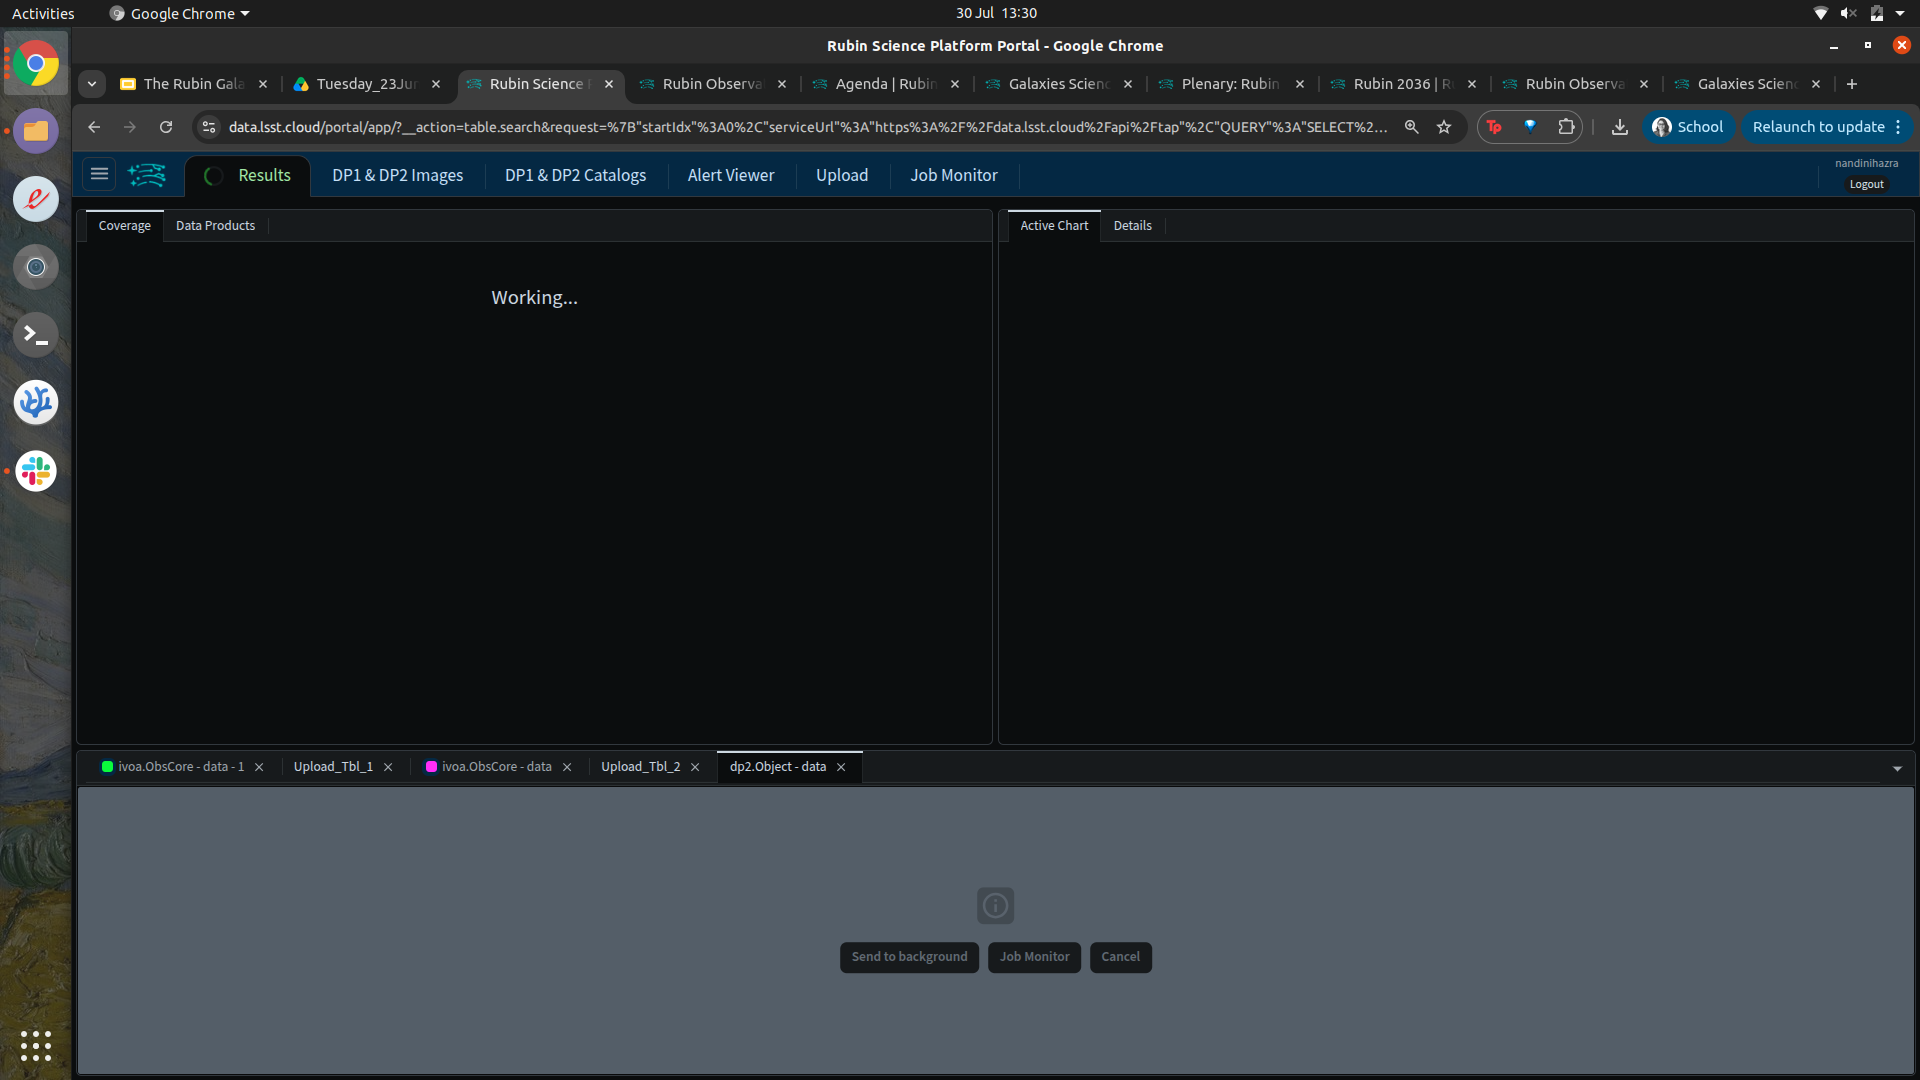
Unfortunately this is definitely still a real problem, I waited for ~4 hours and stayed on the Tab (keeping it open and active in the foreground). Both the successful and failed queries kept on “running” and showed me the screen which is in my dp2_1.png screenshot on top.

I believe this may have been what happened. I could do a screen record, but this might take me a while to figure out how to do. And could I email it somewhere or share it via Slack instead of in this thread?

Thank you for helping me out and for your patience!

You can copy your video recording to your RSP home directory and let us know its name in this thread. Only our staff will be able to access it. You’re also welcome to slack me (@frossie) or direct message me on this forum with any other mechanism you might prefer, but the first option is preferable.

If you are a Mac user, QuickTime is easy to use I think. File → New Screen Recording