Hello, recently I met some questions when I want to draw a x,y residual map like the margin of this image δx, δy like this:(And I also wonder, if LSST pipeline has function used to draw the distortion map below)
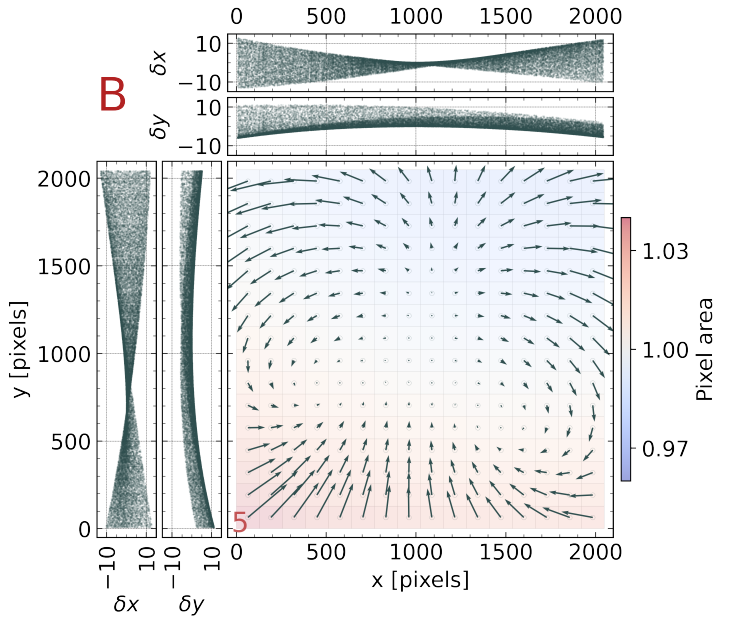
And I
when I want to use the product of the output to draw the image, before draw the difference, I first text the wcs, I use butler to get one calexp and src:
calexp_wfst = butler.get('calexp',visit=int(visit_id),instrument='WFST',detector=detector_id,exposure=int(visit_id),collections='u/yu/singleFrame')
src = butler.get('src',visit=int(visit_id),instrument='WFST',detector=detector_id,exposure=int(visit_id),collections='u/yu/singleFrame')
calexp_wcs = calexp_wfst.wcs
and use the wcs to convert the ra dec:
calexp_wcs.skyToPixelArray(src[0]['coord_ra'],src[0]['coord_dec'])
(array([199.0001958]), array([7.0002436]))
but in the src table, the x and y is:
[src[0]['base_NaiveCentroid_x'],src[0]['base_NaiveCentroid_y']]
[199.0072765265067, 6.9102402201441295]
(I think they should be the same), why there are different, thank you!
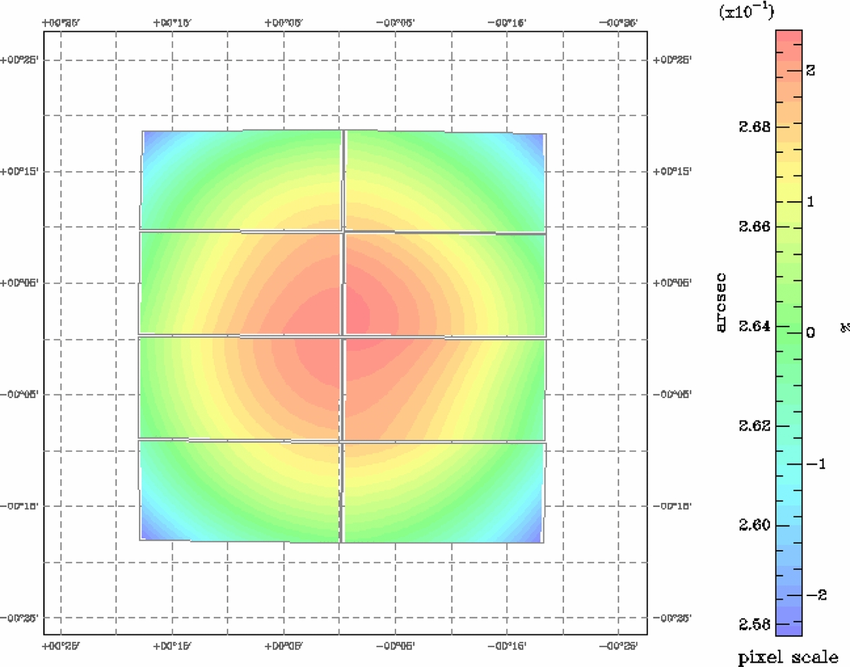
And I also wonder, if LSST pipeline has function used to draw the distortion map figure like scamp below?
(I has see a checkmatch in meas_astrom but is not used to draw the picture)