hi,
so i had tried to pick type 1a SNe from DiaObject table by crossmatching truthtable to diaobject(thanks to Douglas L Tucker for the code ),
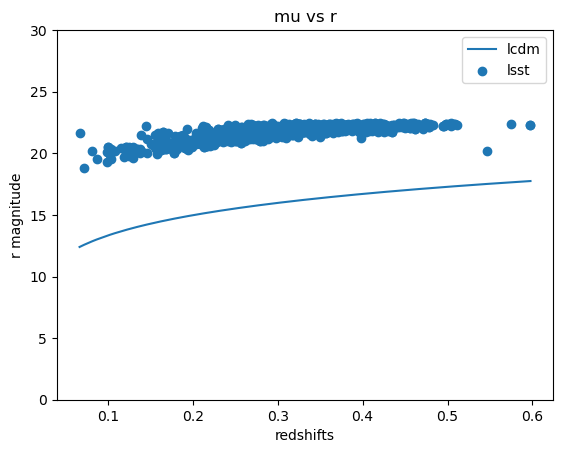
then i plotted the redshift vs magnitude in r band for them and compared them against standard flat LCDM model predictions, the curves roughly look similar but there is a seperation of about 5 units in magnitude(plot and code attached),
because the stimulations assume flat LCDM model i am unable to understand the reason of the shift, which appears apparent in all bands, can you suggest if i am doing somethig wrong in the code ?
Untitled5 (1).ipynb (90.7 KB)
Hi Akshita, I think there’s something wrong with the predicted brightnesses for SNeIa (the solid line). At a redshift of 0.1, for standard flat LCDM cosmology, the distance modulus is 38.3 mag, and a standard Type Ia supernova with peak brightness of about -19 mag (ballpark estimates here) would have an apparent brightness of about 19.3 mag. Which is about where the points are showing up, for redshift 0.1.
thank you , i realised i did a mistake in unit conversion from Mpc to pc somewhere,
should i use peak brightness = 19.5 (the assumed luminosity of all type 1a SNe ), because i suppose it is not mentioned anywhere in LSST white paper?
It depends on what you’re trying to do. For ballpark estimates, assuming M = -19 mag as the intrinsic peak luminosity for SNeIa is OK, but -19.3 mag is more accurate, and any scientific analysis would account for the dependency on magnitude system, filter, and light curve decline rate.
If you’re looking for literature on SNIa light curve standardization, some of the classics include the following papers. In the last on the list, equation (1) references the peak intrinsic brightness of -19.3 mag for a standard SNIa.
The Absolute Magnitudes of Type IA Supernovae, Phillips 1993
The Absolute Luminosities of the Calan/Tololo Type IA Supernovae, Hamuy et al. 1996
Measurements of the Cosmological Parameters Ω and Λ from the First Seven Supernovae at z >= 0.35, Perlmutter et al. 1997
Type IA Supernova Explosion Models, Hillebrandt & Niemeyer 2000
thank you, i will look into these. as you suggested in one of the other posts that the query method given in tutorials is only to get rougly sne like objects, so it isnt so accurate.
can you suggest, how should one, for a good analysis get type 1a SNe data, more accuretely?
like can we first pull out these SNe like objects using query, then create there light curves and use tools like pySALT analysis to get peak brightness, redshift, and other things? is this way feasible and are there other ways?
Hi Akshita,
You are absolutely right that the next step is to use other tools, like a light curve fitter, to be more sure that the objects are SNIa and to get their peaks, redshifts, etc.
I wasn’t familiar with PySALT, but it looks like its primary function is the reduction and analysis of data from the SALT telescope. I’m not sure there are SN analysis modules in there?
Some other SN-specific codes which include light curve fitting modules are Rick Kessler’s Supernova Analysis package (SNANA; https://github.com/RickKessler/SNANA), the Carnegie Supernova Project’s SuperNovae in Object Oriented Python (SNooPy; https://csp.obs.carnegiescience.edu/news-items/snoopy-released), and Kyle Barbary et al.'s SNCosmo package (https://sncosmo.readthedocs.io/en/stable/about.html).
What I’m not sure is which package would be the best for your science goals, or which would be best suited (easiest to install and run) in the RSP environment. That is a choice only you can make. But I would be very interested in hearing what you try, and how it works out.
You might also find useful this FAQ in the DP0.2 Jupyter Notebook instructions page: “How do I install packages in my user environment?”
I just consulted the DESC folk who generated the DC2 SNe Ia, and I was told that the reason there are so few SNe Ia beyond z=1.0 in the truth tables is that they only included “hostless” SNe Ia beyond z=1.0 (to conserve computing resources). Below z=1.0, the simulations contain both SNe Ia with host galaxies and SNe Ia without host galaxies. The number of SNe Ia without host galaxies is much smaller than the number with host galaxies.
1 Like