I also tried pip install latex as you did, and can confirm that afterwards, which tex does not yield a response and that setting plt.rcParams['text.usetex'] = True in a notebook (I think similar to setting a matplotlib style file?) produces the same RuntimeError.
But, what’s the end goal? If you’re looking to use latex in axes labels, for example, the following works.
import matplotlib.pyplot as plt
import numpy as np
### Don't do this, it will raise an error
# plt.rcParams['text.usetex'] = True
xvals = np.arange(360)
yvals = np.cos(np.deg2rad(4.0 * np.pi * xvals)) + 2
fig = plt.figure(figsize=(6, 4))
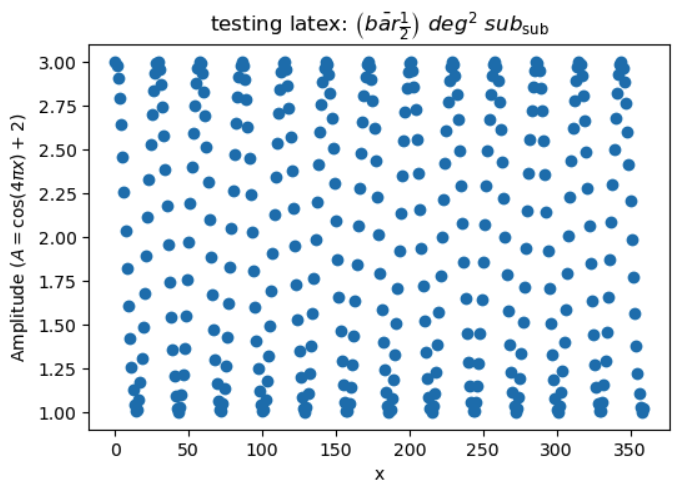
plt.plot(xvals, yvals, 'o')
plt.xlabel('x')
plt.ylabel(r'Amplitude ($A = \cos(4\pi x) + 2$)')
plt.title(r'testing latex: $\left( \bar{bar} \frac{1}{2} \right) \ deg^2 \ sub_{\rm sub}$')
plt.show()
Hi @MelissaGraham thanks for the reponse and your testing (and thank you @ameisner for your suggestion).
Like I mentioned, it’s not research-breaking, I just prefer the usetex styling and would like to stay consistent in my plots on and off the RSP. If there’s no easy fix, then I will certainly survive without it.
Hi @steventgk , thanks for confirming that the existing math-formatted labels aren’t what you’re looking for, and that you’re after the overall usetex styling. That’s not an unreasonable request! And there may well be a fix out there. I’ve opened up an internal ticket for this (SP-2385) and we’ll report back. I get it - papers look much better (and referee complaints can be avoided) when figures all match stylistically.
In the meantime, if anyone else has gotten this to work in the RSP, do share here in thread.
Hi again, after some internal discussion it turns out that LaTeX is not a part of the container yet because the distribution is enormous and has many evolving dependencies – and for the same reason, it is not recommended for individual users to try and install it (and the LaTeX installed with pip is not the full distribution, and is not expected to work like we expected, @steventgk).
Short term, the solution to this topic is that no, latex-style plots in the RSP are not possible at this time. But longer term, it is on the list for staff to consider as a future addition to the environment.