Stacking deepcoadd images

Hello everyone, is it possible to easily obtain stacked images of deepcoadd images? Or at least to easily identify the adjacent patches of a patch in a tract? I have a deepcoadd image with a cluster on the border of it, and would like to create an image that includes the entirety of the cluster. Ideally, I would like to get an image of at least 1 Mpc at the cluster’s redshift, centered on the cluster center.

One way to do it would be to compute the coordinates of the corners of the 1 Mpc box, identify for each corner its corresponding tract and patch, retrieve all images and then stack them. But it is quite a hassle…

Sorry if the question had already been asked, but I couldn’t find an answer for it!

Dear Aline,
Is it possible to provide the RA/Dec and the on-sky extent of the area you’re interested in?
Thanks,
Christina

Hi Christina, the cluster in question is at ra, dec = 50.5265, -39.7589
The extent of the final image should cover ~ 6 arcmin
Thanks!

This is a visualization in the Portal of the overlapping and nearly-overlapping coadd patches in the vicinity of the target.

As you can see from the “ruler”, it’s less than an arcminute from the border of the “most centered” patch.

I think for a mosaic one would want to combine tract 3442, patches 13 and 20.

Probably the hassle is quite a bit less for two patches from the same tract, because they are pixel-aligned by definition. However your point is a good one in general and ultimately we would like to make it more straightforward for users to obtain mosaics for arbitrarily-located, but reasonably-sized, regions on the sky.

Hi Gregory, thanks for your answer!

Is there a function one can call to know directly what patches are adjacent to one? Without having to use a visualisation tool? I am working on the whole DC2 cluster catalogue and it is very likely this cluster is not the only one on the border of a patch, so this would be very helpful!

Working on a thorough answer, possibly not ready until Monday.

You may have a better answer coming your way, but in the meantime, if I wanted to find a list of tract/patches that overlap a [list of] RA/Dec for a given skymap I would use: BaseSkyMap — LSST Science Pipelines

e.g.

from lsst.daf.butler import Butler
import lsst.geom as geom

butlerRoot = "/repo/dc2"
collection =  "skymaps"
instrument = "LSSTCam-imSim"
skymapName = "DC2"

butler = Butler(butlerRoot, collections=collection, instrument=instrument, skymap=skymapName)
skyMap = butler.get("skyMap", instrument=instrument)

raDeg = 50.5265
decDeg = -39.7589
point = geom.SpherePoint(raDeg, decDeg, geom.degrees)
coordList = [point]
tractPatchList = skyMap.findTractPatchList(coordList)
for tractPatch in tractPatchList:
    tract = tractPatch[0]
    patchInfo = tractPatch[1]
    for patch in patchInfo:
        print(tract.tract_id, patch.sequential_index)

prints:

3441 7
3442 13

Hi @achu,
Just wanted to follow up to see if @laurenam’s suggestion was able to address your question on stacked deepcoadd images.

Hi @achu,
I think we figured out a solution for your case using the LSST pipeline. You can use GetTemplateTask, which is made to warp and combine coadds. But since the two adjacent patches belong to the same tract (and therefore share a common projection, bounding box, WCS) this is easy to do without redefining the WCS (since its the same for both). Below is a code snippet demonstrating how to join the two adjacent patches into one image and then plot the cluster extent on top of the combined image.

# LSST package imports
import lsst.afw.display as afwDisplay
from lsst.daf.butler import Butler, CollectionType 
from lsst.ip.diffim import GetTemplateTask

# Plotting functions
import matplotlib.pyplot as plt

# photutils to sanity check WCS
from photutils.aperture import * 

# Astropy
from astropy import units as u
from astropy.coordinates import SkyCoord
from astropy.wcs import WCS

# Set afw display backend to matplotlib
afwDisplay.setDefaultBackend('matplotlib')

# initialize Butler
config = 'dp02'
collection = '2.2i/runs/DP0.2'
butler = Butler(config, collections=collection)

# RA/Dec that is near the edge of a patch (13) and tract (3442). 
ra = 50.5265 
dec = -39.7589 
coord = SkyCoord(ra=ra*u.degree, dec=dec*u.degree, frame='icrs')

# The cluster is 6 arcmin diameter
radius = 3 * u.arcmin

# The ra/dec of interest is patch 13. The adjacent patch is 20.
dataId1 = {'tract': 3442, 'patch': 13, 'band': 'r'}
dataId2 = {'tract': 3442, 'patch': 20, 'band': 'r'}

nImage1 = butler.get('deepCoadd', dataId=dataId1) 
nImage2 = butler.get('deepCoadd', dataId=dataId2) 

# grab the bounding box, WCS (same for both patches), 
# and assemble list of image and dataIds
bigImageBBox = nImage1.getBBox().expandedTo(nImage2.getBBox())
wcs = butler.get('deepCoadd.wcs', dataId=dataId1)
coaddExposures = [nImage1, nImage2]
dataIds = [dataId1, dataId2]

# Build the joined image of two adjacent patches
x = GetTemplateTask()
newimage = x.run(coaddExposures, bigImageBBox, wcs, dataIds)

# setup to plot in sky coordinates
new_wcs = WCS(newimage.template.getWcs().getFitsMetadata())
plt.subplot(projection=new_wcs)
extent = (bigImageBBox.x.min, bigImageBBox.x.max, bigImageBBox.y.min, bigImageBBox.y.max)
plt.imshow(newimage.template.image.array, vmin=.1, vmax=1, extent=extent, origin='lower', cmap='gray')

# plot the extent of the cluster centered at specified ra/dec
aperture = SkyCircularAperture(coord, r=radius)
pix_aperture = aperture.to_pixel(new_wcs)
pix_aperture.plot(color='r', lw=3)

Hi all, thanks for all these recommendations! It is conference week for me, so I will not have time to test it out until next week so I will keep you updated then.

Quick question though: some clusters are indeed at the intersection between two patches in two different tracts. How would one need to modify the WCS in such a case?

Hi all,

I have tried implementing your suggestions into my code. Christina’s solution works great for the given case! But I have encountered some issues and would love a bit of help:

  • I ran Christina’s code as is, and wanted to save the image as a fits file with a WCS. After much digging, I could not find in the documentation a function to save a “Struct” object (output of the GetTemplateTask.run function) to a FITS file. My workaround was the following:
data = newimage.template.image.array
new_wcs = WCS(newimage.template.getWcs().getFitsMetadata())
fits.writeto('test.fits',data, new_wcs.to_header())

Even though the displayed image correctly shows the position of the cluster, for some reason, the saved FITS image has a WCS that is completely off (see attached fig). I am also afraid of losing additional header information by doing so (such as exptime, etc).

  • Using the GetTemplateTask() on patches of two different tracts returns something that I do not really understand. Here is an example at
    ra, dec = 50.457678726201266, -39.85531585828613
    dataId1 = {‘band’: ‘r’, ‘tract’: 3441, ‘patch’: 7}
    dataId2 = {‘band’: ‘r’, ‘tract’: 3442, ‘patch’: 13}

The GetTemplateTask() documentation indicates it should work for two different tracts, but not much more.

mosaic_twotracts-2

My questions are:

  • How to correctly retrieve the new wcs of the coadded image, as well as the corresponding header?
  • How to save the result of this coadd into a fits file with header and was?
  • How to correctly project the second tract onto the first one?

Thanks a lot in advance!

Hello, to save the new image as a fits file, use this instead:

newimage.template.writeFits('my_new_image.fits')

Caution as the file is 510 MB!

But here’s a screenshot of the file, downloaded and displayed in DS9 (as I think you want to do) showing that the header WCS is intact:

As far as making an image which spans tracts (instead of just patches within a tract, as in the sample above) - work continues to provide a demo of this.

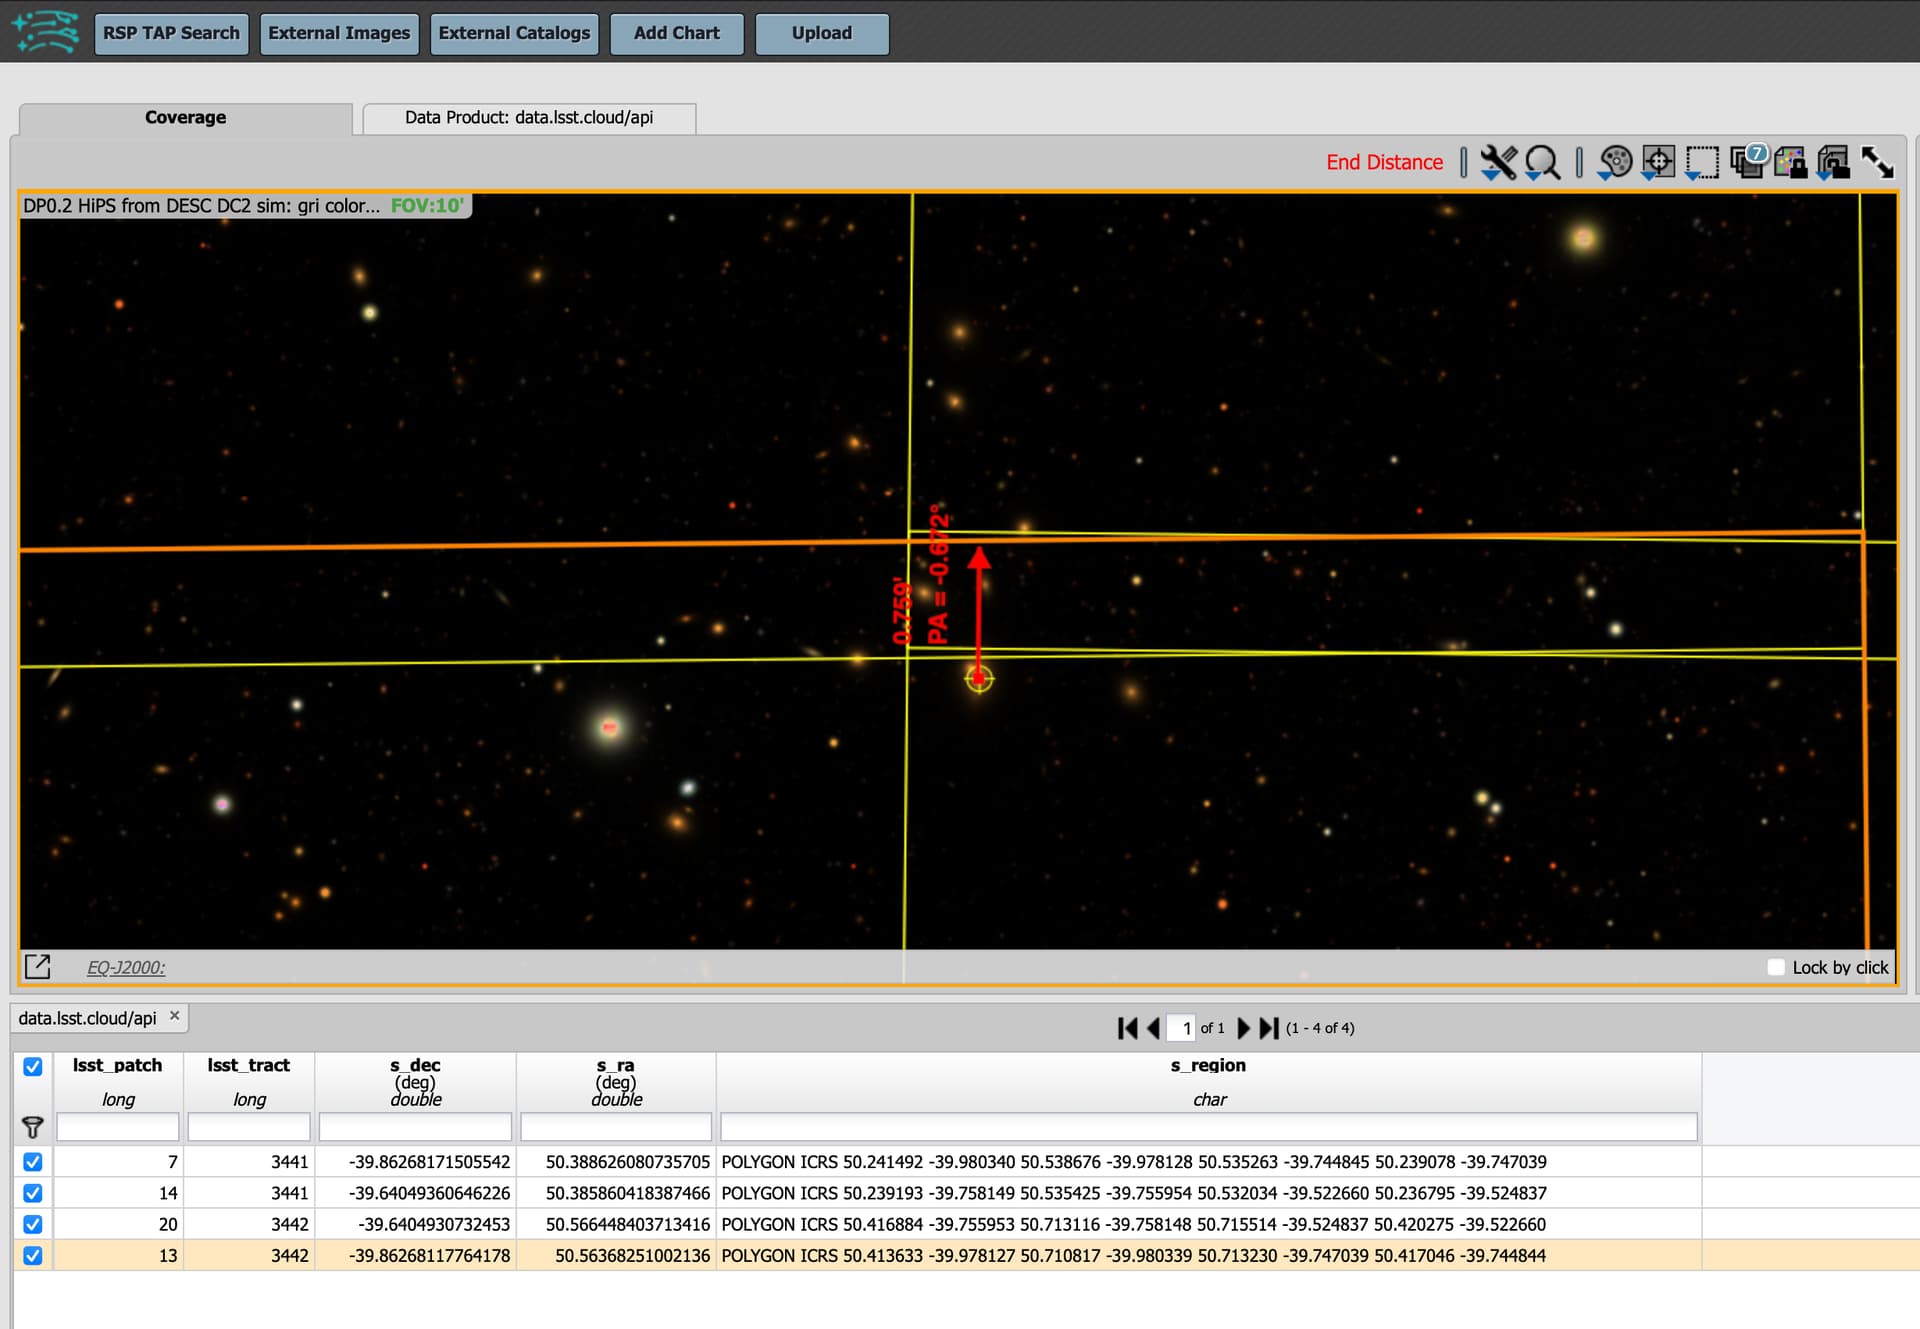
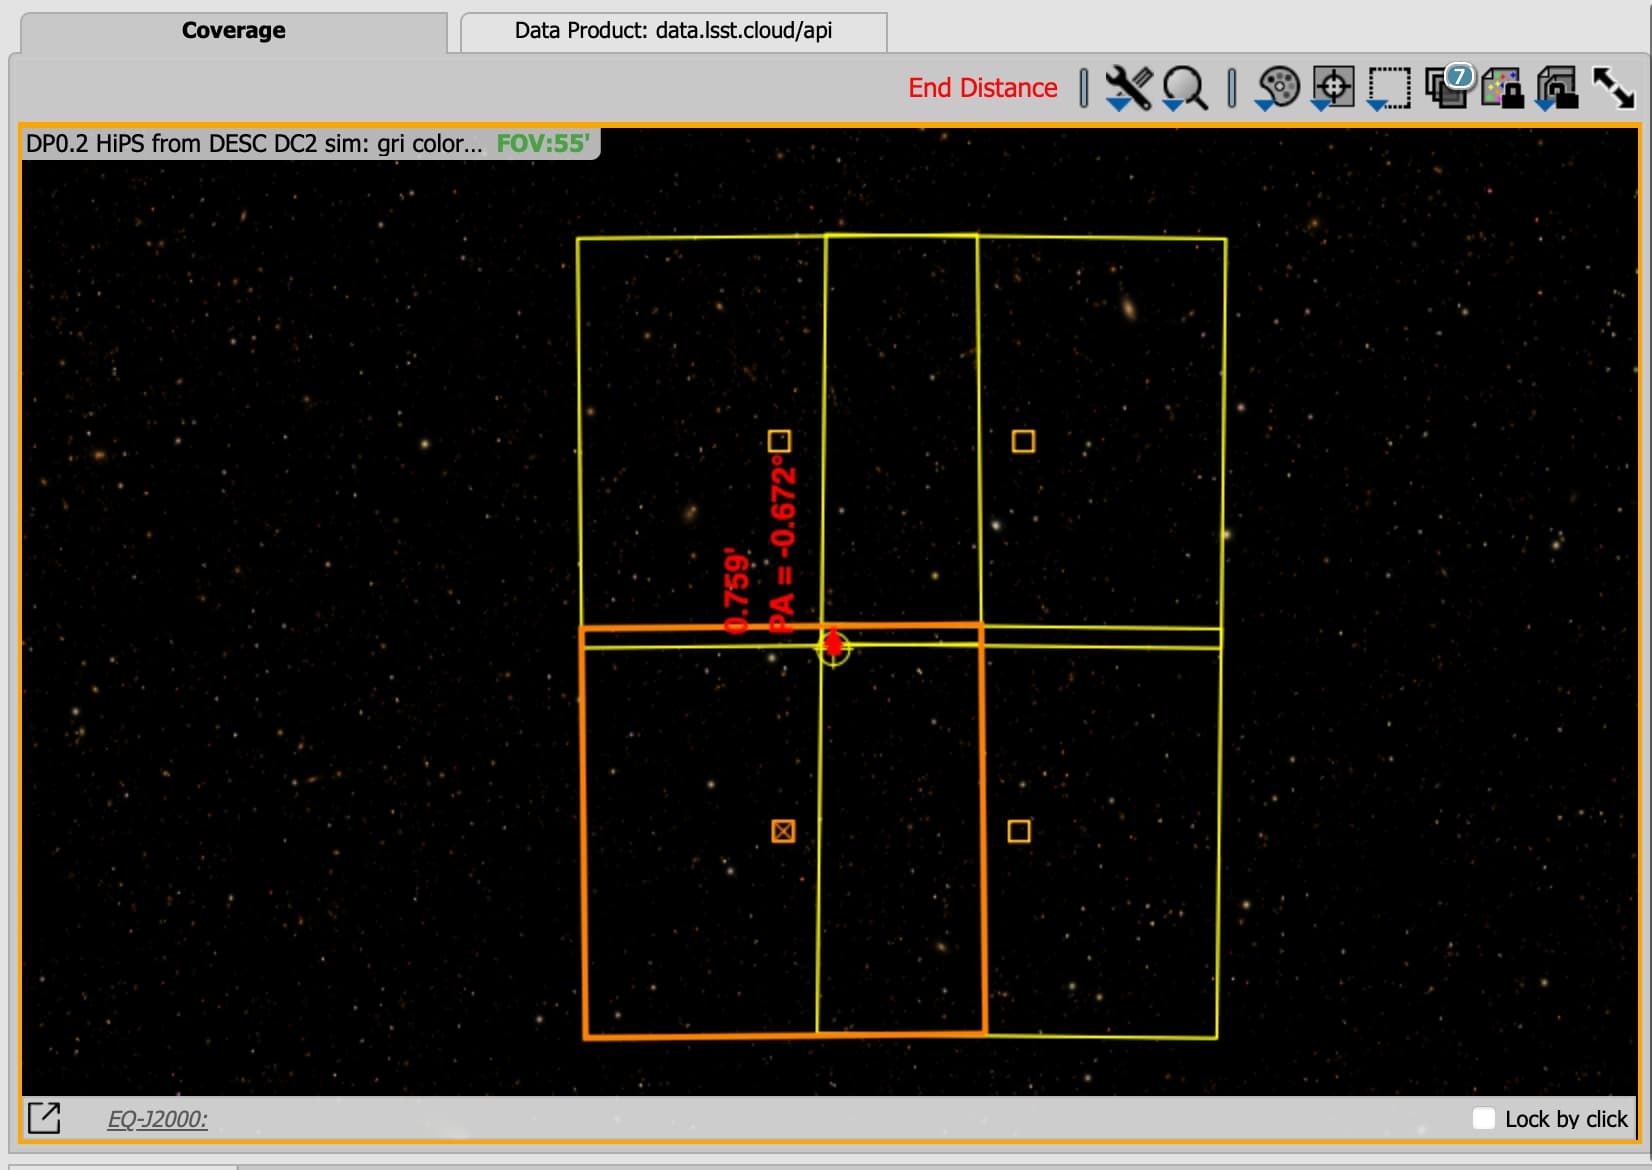
Hello again, I have a (bit of a hack) method for using GetTemplateTask with patches from two different tracts, instead of the same tract. It comes down to defining the bounding box. That’s the part that wasn’t working.

I found that bigImageBBox = nImage1.getBBox().expandedTo(nImage2.getBBox()) didn’t produce an appropriate bounding box. Image 2 is east of Image 1, but the bigImageBBox gets expanded to positive X pixels. When GetTemplateTask is used to project Image 2 into bigImageBBox, there are no pixels at the location of the Image 2 data. At least, that’s my interpretation of what’s happening.

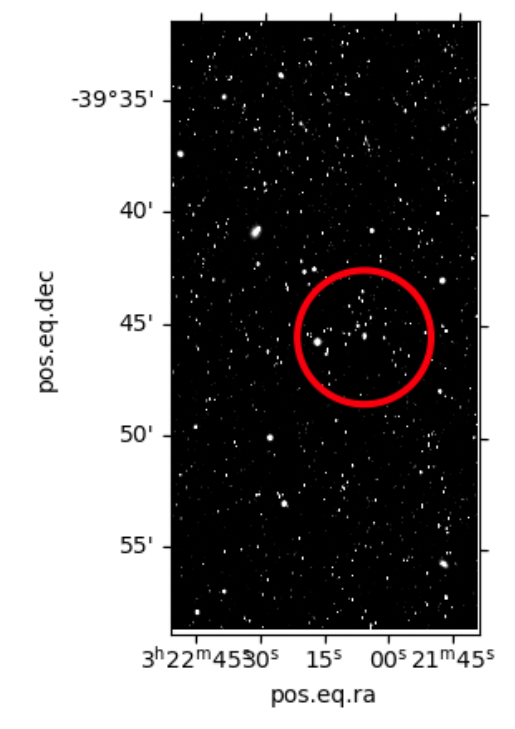
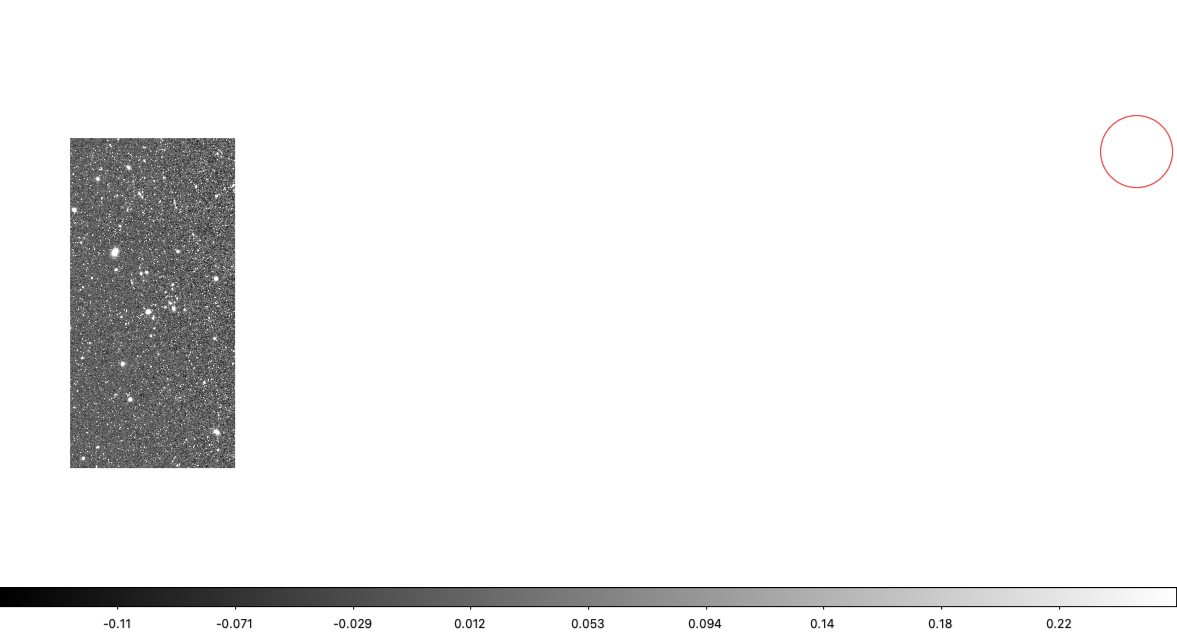
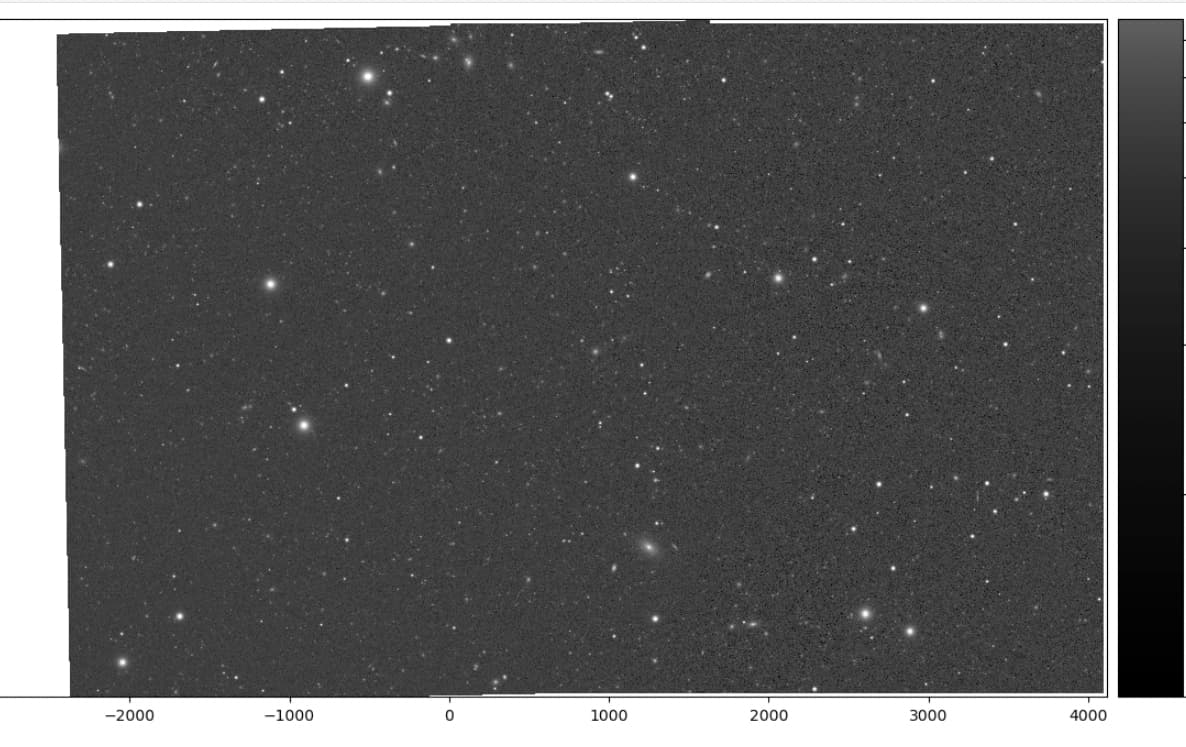
Below, a bigImageBBox is defined by hand to be what I estimated as an approximately appropriate expansion of Image 1 to allow for pixels from Image 2. In the image below the code snippet, it seems I might have underestimate the lower extent of bigImageBBox and cut off a bit of the bottom left, but, at least this gives the idea. And the patch/tract boundary looks pretty seamless.

import lsst.afw.display as afwDisplay
from lsst.daf.butler import Butler
from lsst.ip.diffim import GetTemplateTask
from lsst.afw.image import Image
from lsst.geom import Box2I, Point2I, Extent2I
import matplotlib.pyplot as plt
import numpy as np

afwDisplay.setDefaultBackend('matplotlib')
config = 'dp02'
collection = '2.2i/runs/DP0.2'
butler = Butler(config, collections=collection)

dataId1 = {'tract': 3441, 'patch': 7, 'band': 'g'}
dataId2 = {'tract': 3442, 'patch': 13, 'band': 'g'}
nImage1 = butler.get('deepCoadd', dataId=dataId1) 
nImage2 = butler.get('deepCoadd', dataId=dataId2) 
nImage1_wcs = butler.get('deepCoadd.wcs', dataId=dataId1)
nImage1_bbox = nImage1.getBBox()
nImage2_bbox = nImage2.getBBox()
print(nImage1_bbox)
print(nImage2_bbox)

img = Image(Box2I(minimum=Point2I(x=-3900, y=3900), maximum=Point2I(x=4099, y=8099)), dtype=np.float32)
bigImageBBox = img.getBBox()
coaddExposures = [nImage1, nImage2]
dataIds = [dataId1, dataId2]
x = GetTemplateTask()
newimage = x.run(coaddExposures, bigImageBBox, nImage1_wcs, dataIds)

fig = plt.figure(figsize=(24, 12))
display = afwDisplay.Display(frame=fig)
display.scale('asinh', 'zscale')
display.mtv(newimage.template.image)
plt.show()

Results of afwDisplay statement above:

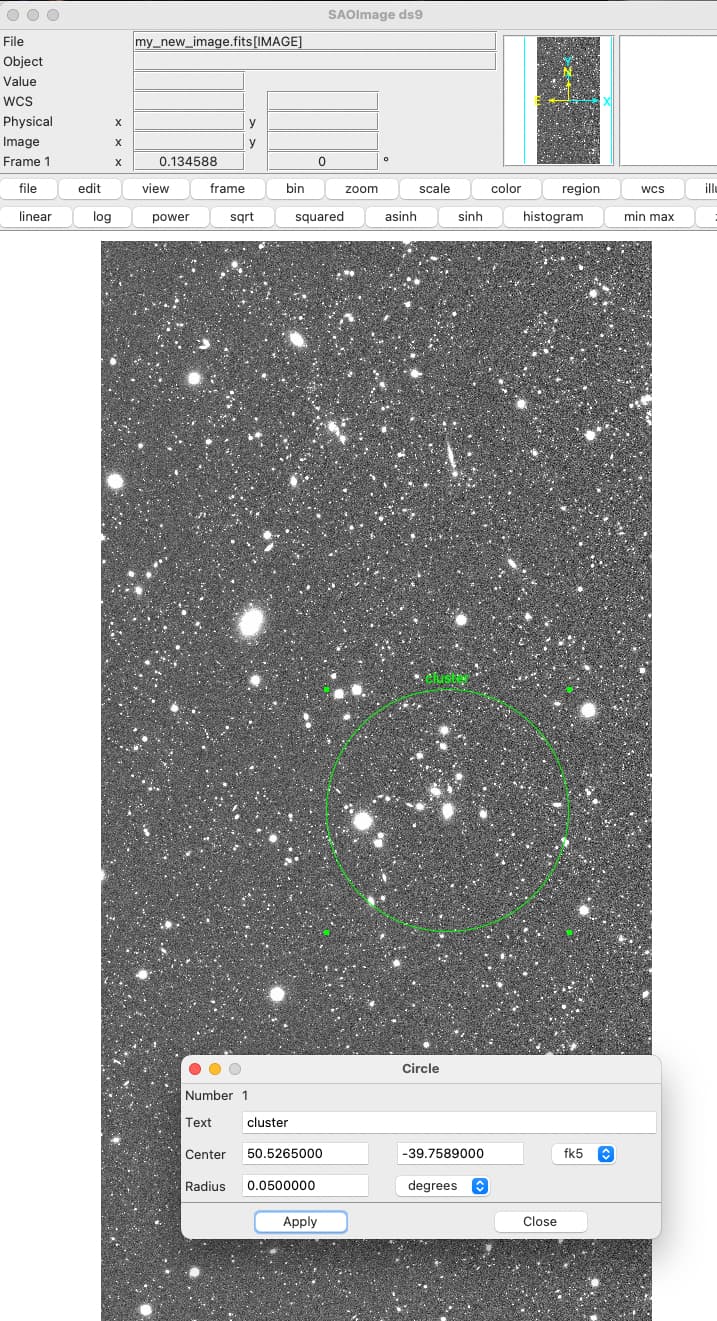
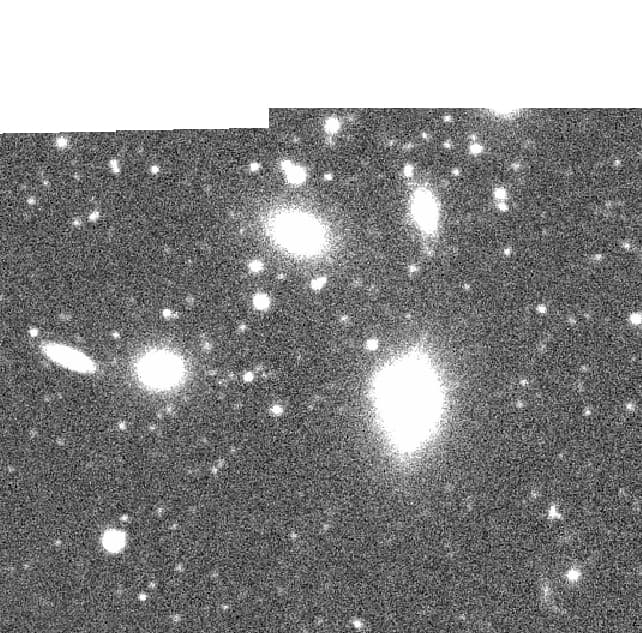
A Zoom in on the seam in DS9:

Hi Melissa, thank you so so much! I think with yours and Christina’s answers, I finally have everything I need to proceed. : ) Thanks again!