Starting from the upcoming weekly, w_2023_27, it will be possible to configure BPS to use quantum-backed Butler (QBB) instead of the execution Butler (EB). For more information regarding differences between EB and QBB, see DMTN-177.
The EB still remains the default mechanism to lessen the number of simultaneous connections to the central Butler database and there is not a single configuration option to enable/disable the QBB. Users who would like to use QBB in their BPS submissions need to include resource://lsst.ctrl.bps/etc/bps_qbb.yaml in their existing config(s) with includeConfigs setting after other includes (if any). For example, to configure BPS to use QBB when executing ci_hcs_gen3 pipeline, the config should be similar to:
includeConfigs:
  - resource://lsst.ctrl.bps/etc/bps_qbb.yaml
pipelineYaml: ${DRP_PIPE_DIR}/pipelines/HSC/DRP-ci_hsc.yaml
project: dev
campaign: ci_hsc_qbb
payload:
  payloadName: cihsc
  butlerConfig: ${CI_HSC_GEN3_DIR}/DATA/butler.yaml
  inCollection: HSC/defaults
  dataQuery: "skymap='discrete/ci_hsc' AND tract=0 AND patch=69"
At the moment, QBB only works with the BPS HTCondor plugin. It will not work with the BPS Parsl and PanDA plugins until respectively DM-39885 and DM-39553 are done.
To be a bit more explicit, QBB is the future and the plan is for BPS to entirely migrate to QBB. There are significant advantages in doing so. There is no need to create a SQLite registry that has to be copied to every node. This speeds up BPS submission (where creating the SQLite file can take a significant fraction of the submission time). Each job only has to download the information it needs to execute without the overhead of the workflow system copying in the file. This can lead to significant performance gains in workflow execution when there is no longer a need to copy a multi-gigabyte file across the network each time.
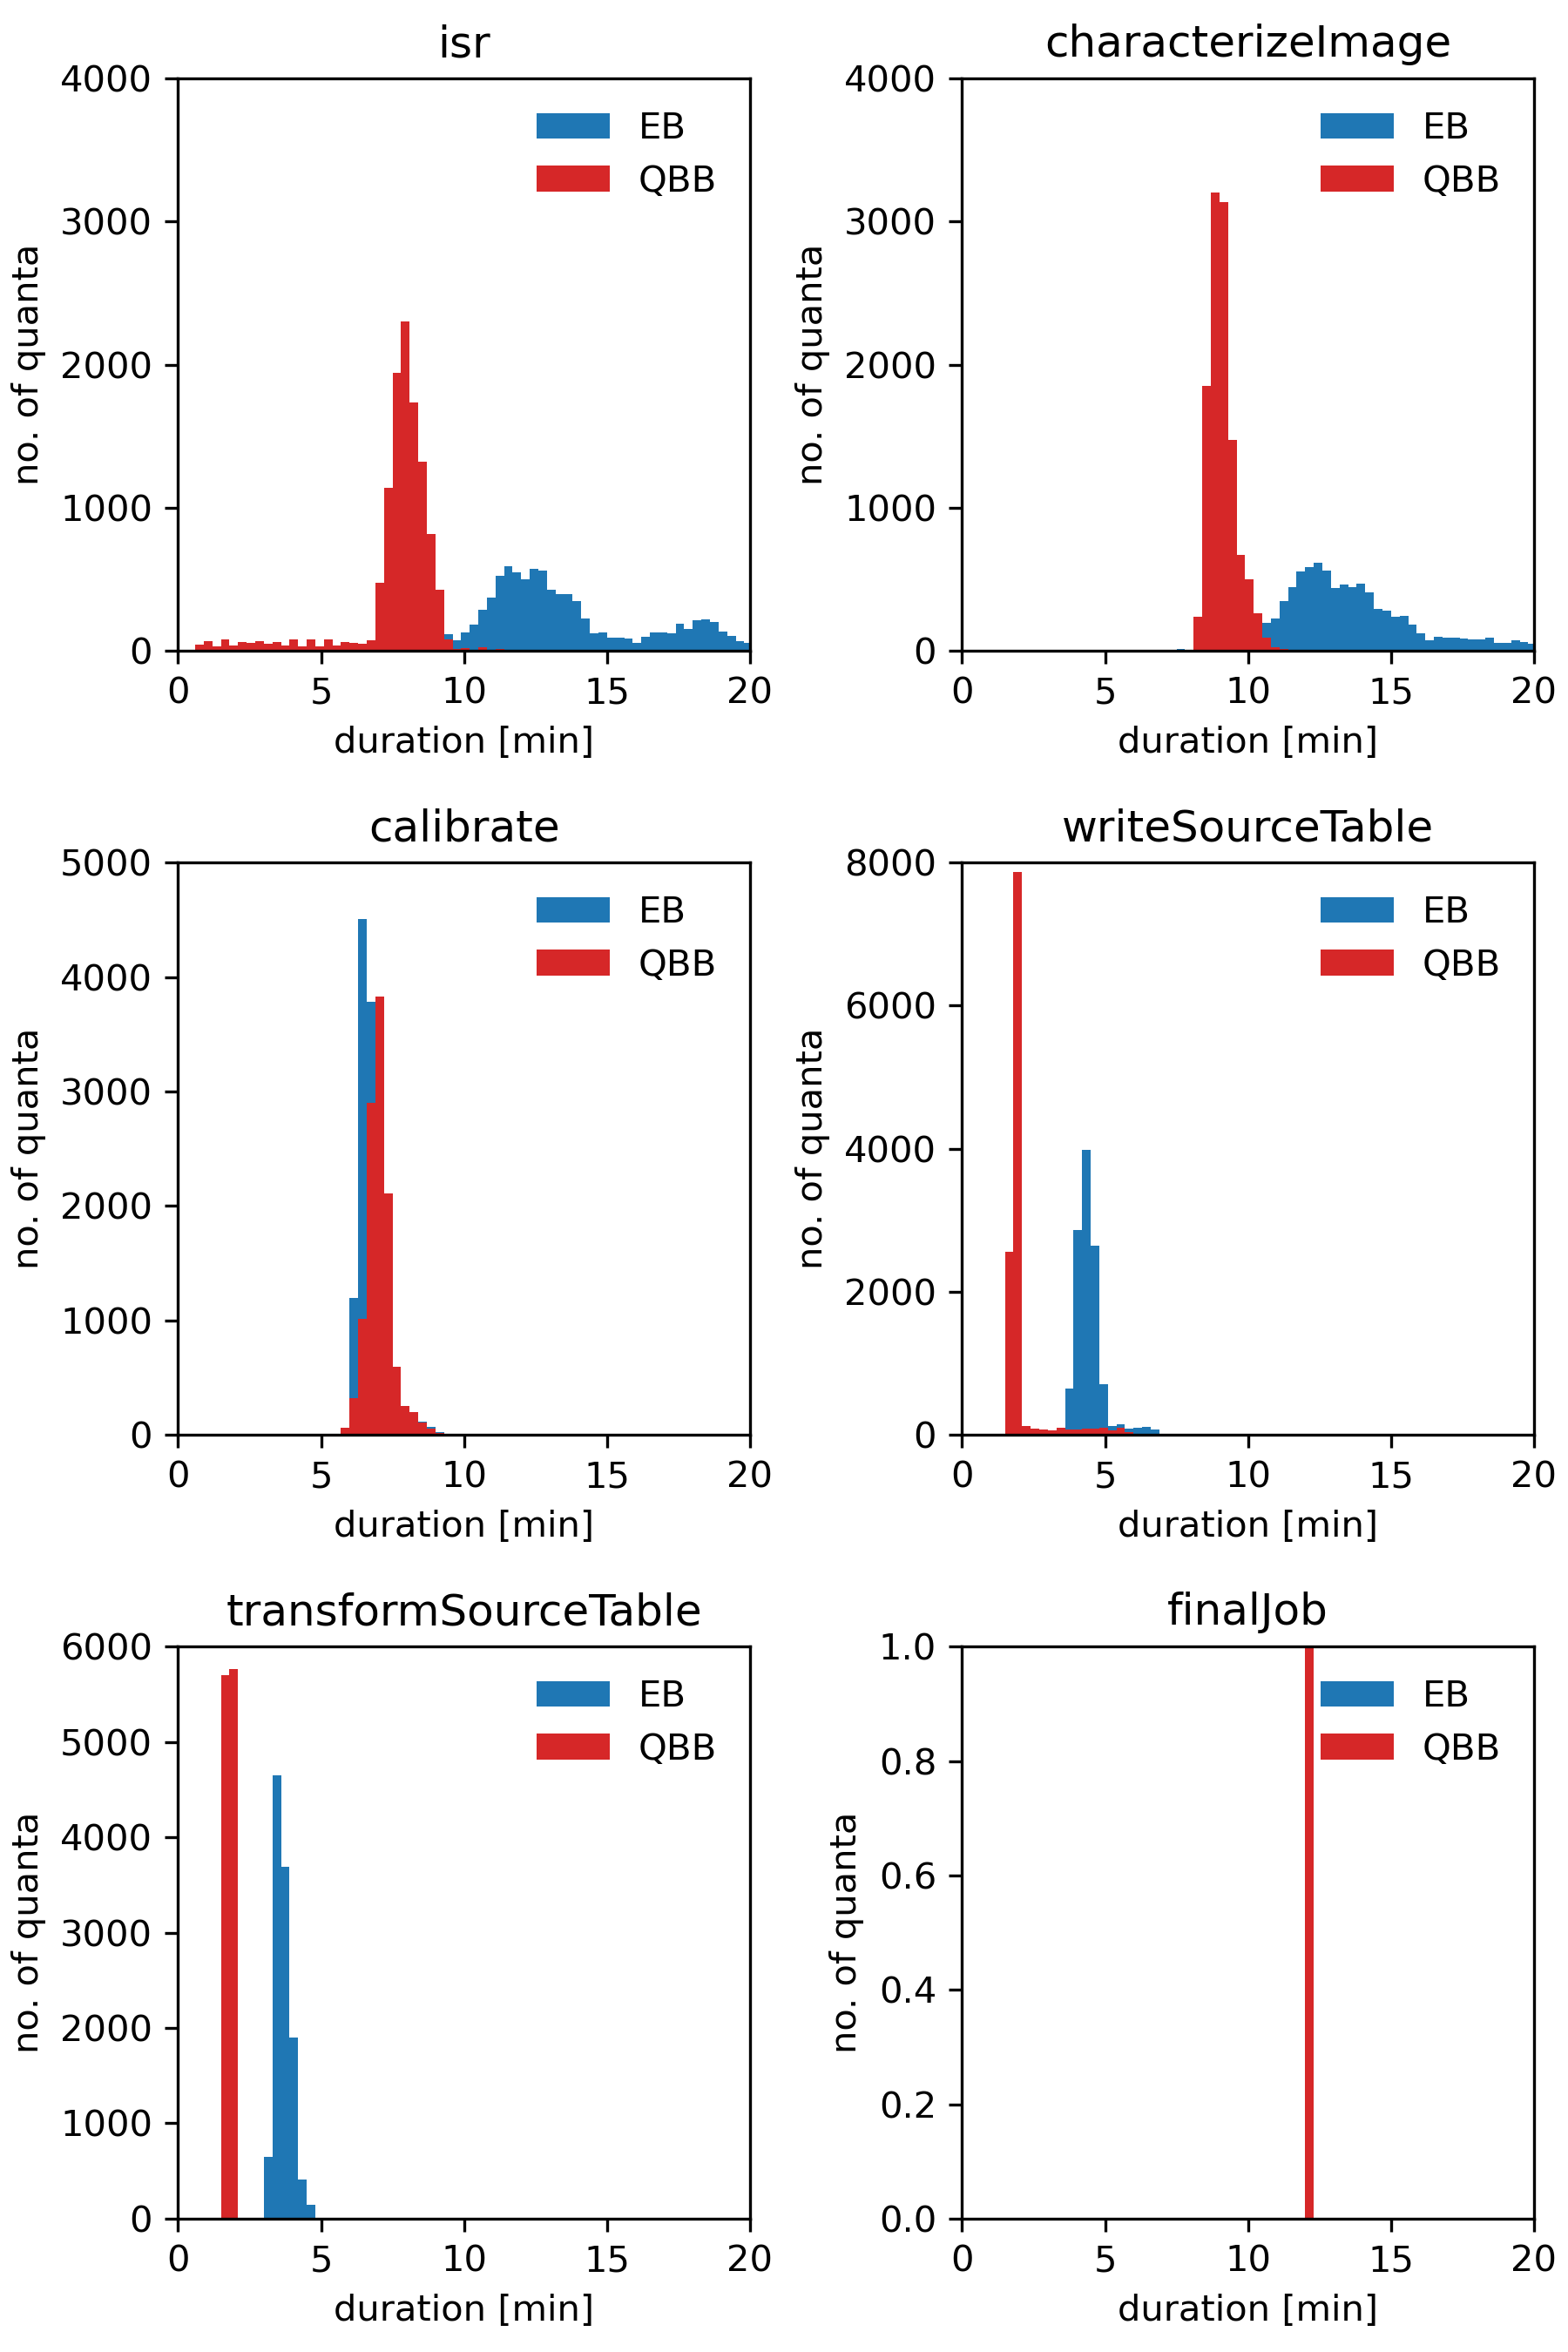
To illustrate Tim’s points I’m attaching an example plot showing distributions of job durations grouped by pipelines tasks. The data were compiled from two runs of Step 1 on DC2 test-med1 (57,305 quanta for each run). Blue histograms show times for the run using EB, red for the run using QBB. In both cases, job duration is the difference between the end and the start of an HTCondor job, not the execution time of the payload.
Was there any clustering going on here, or do the x axes really refer to the time it takes to execute a single quantum of these tasks?
If so, while switching to QBB would be a nice improvement, there is still an absurd amount of overload here: isr, characterizeImage, and calibrate should be of order a minute or two combined in terms of task execution.
No. Clustering would have worked against the underlying test because there would have been only one job running and so far fewer copies of the execution butler to the node. This was trying to demonstrate QBB improvements over EB.
Yes, 7 minutes for isr is still odd. @mxk will have the data to be able to show the pipetask execution time and so calculate the overhead. The log should also show the time when pipetask starts running if you want to look at the start up overhead before the payload overhead takes over.