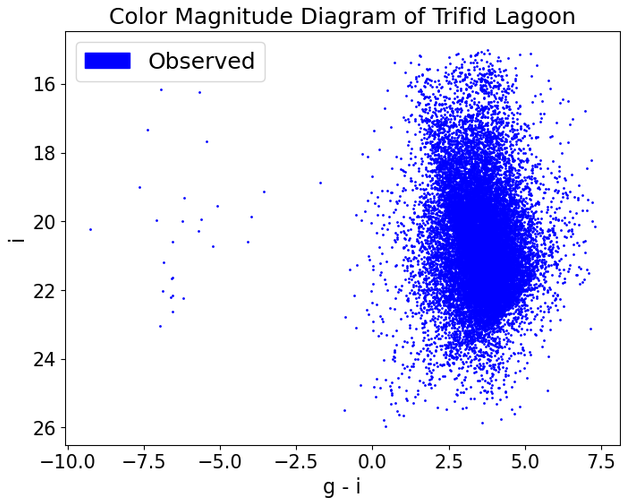
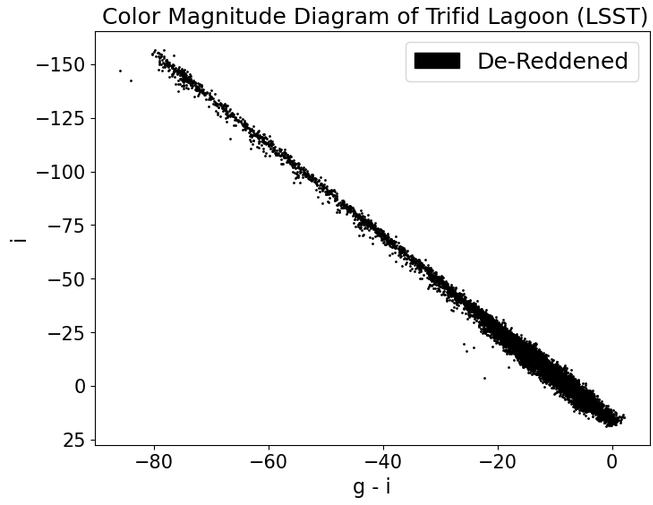
While creating a color magnitude diagram (CMD) for the Trifid Lagoon region in DP2 I ran into wild values after applying the dust correction to the CMD values. By applying the code seen in the 302_2 jupyter notebook tutorials our plots came out as:
The dust correction tutorial and code does not produce a helpful CMD for the given region, so what are some other ways/techniques we can apply to produce a successful dust corrected CMD of Trifid Lagoon?
Hi @nqndozs, thank you for providing the code for the plot. The E(B-V) values from the SFD dust map in regions like the Trifid Lagoon nebula are not reliable due to contamination in the 100-micron dust emission map. Section 4 of tutorial notebook “311.1 MW dust extinction correction” demonstrates this issue. The dust map to use in this region to produce dust-corrected CMDs is up to the user to decide.