I’m in the process of planning a near-infrared time domain survey with PRIME telescope (1.8 m telescope, 1.56 sq deg FOV, 0.5"/pixel, wavelengths 900-1800 nm, located in Sutherland, South Africa). The plan is to visit the same fields on the same night as Rubin in J and H bands.
However, I don’t know where to find the planned/executed pointings. I thought the information would be accessible on the Scheduler Reports page, but it hasn’t updated in over a month. Is this information available somewhere else? Is there an API?
We have suspended these reports while we’re waiting for recovery from the storm – to make this more clear, we’ve added a header to the main page (ls.st/nightlyreports) which links to the NOIRlab recovery news.
That said – I would be happy to talk to you a little bit more about what you’re trying to use this information for. The prenight simulations are not prescriptive for behavior at the summit, they are an approximate guide – so the exact pointings we have in the prenight sims will sometimes match the pointings at the summit, but much of the time they won’t. It’s not clear to me how precisely you need your pointings to align with Rubin’s observing, but it’s possible this is not going to meet your expectations.
We are working on understanding how we can better communicate the uncertainty in the predictions coming from the prenight simulations (which are generated on average 12 hours before the night starts in Chile). The Schedule Viewer will eventually also contain updates coming from the summit at times closer to the actual acquisition of observations , as well as the next upcoming visit. As the time of the prediction gets closer to the time of the acquisition of the visit, the certainty improves.
Thank you! The schedule viewer service seems to be what I’m looking for. I understand that due to weather, and other complications the observations won’t go exactly as planned. A simulated schedule generated 12 hours ahead of time is better than what I was expecting. It sounds reasonable to work under the assumption that the simulated pointings will be accurate when planning our schedule, and then deal with data drop-outs as they come.
You might want to look through some of the “compareprenight” reports in ls.st/nightlyreports. These take the various prenight simulations (we run > 1, although only the nominal sim goes through to the schedule viewer) and compare how they matched up against the real observations we acquired.
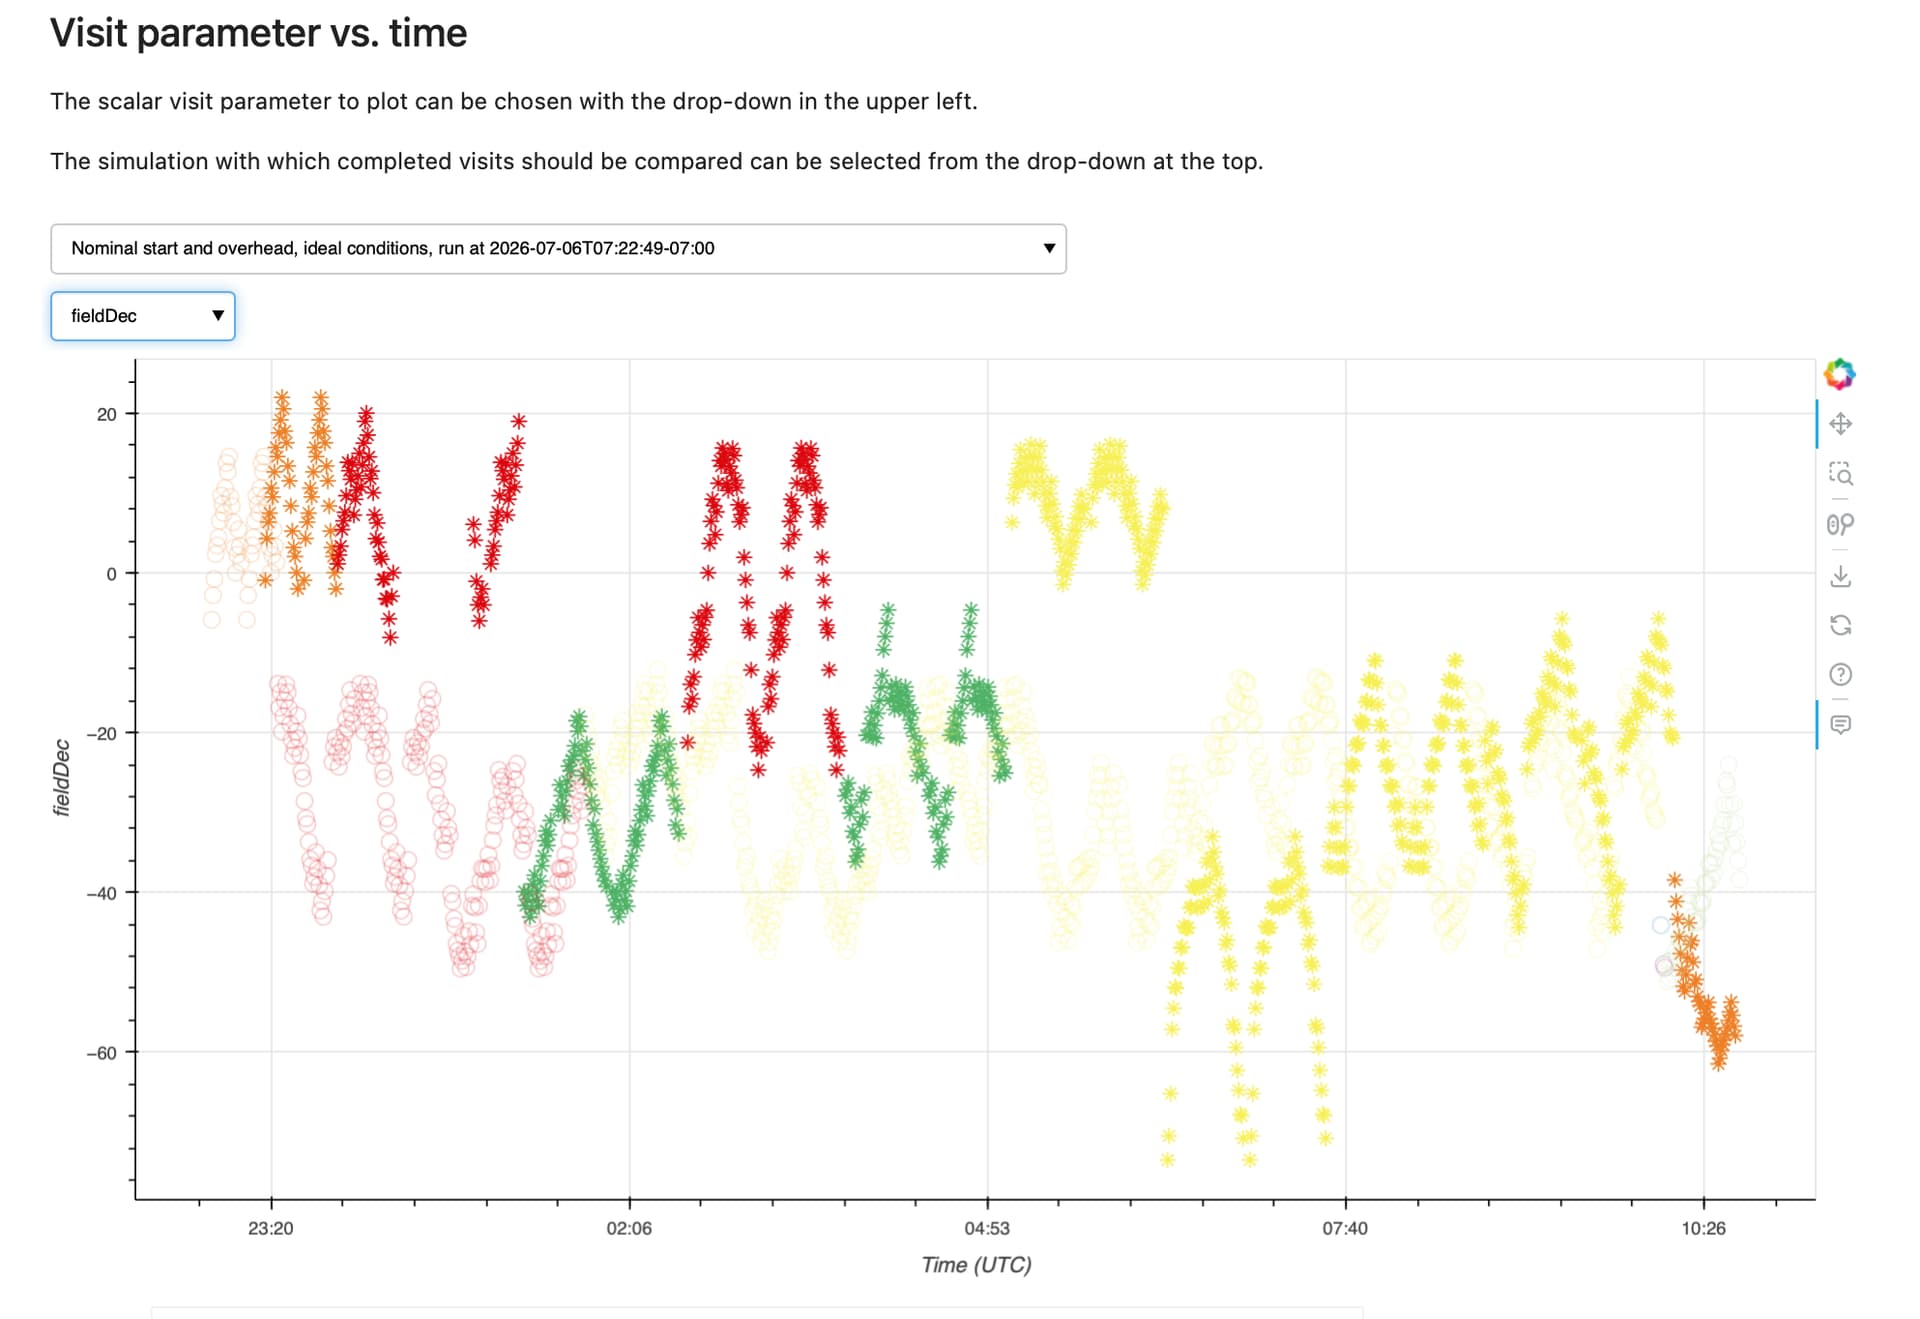
The reports here so far are still early in development, but aren’t necessarily too hard to follow … the first time line plot, for example, shows you similar things to the night summary report, but adds one or more of the prenight simulations as open symbols, so you can compare prediction vs. actual visit – e.g. in this plot, the declination of each field observed in the night is shown in solid, while the simulation prediction is the open circle.
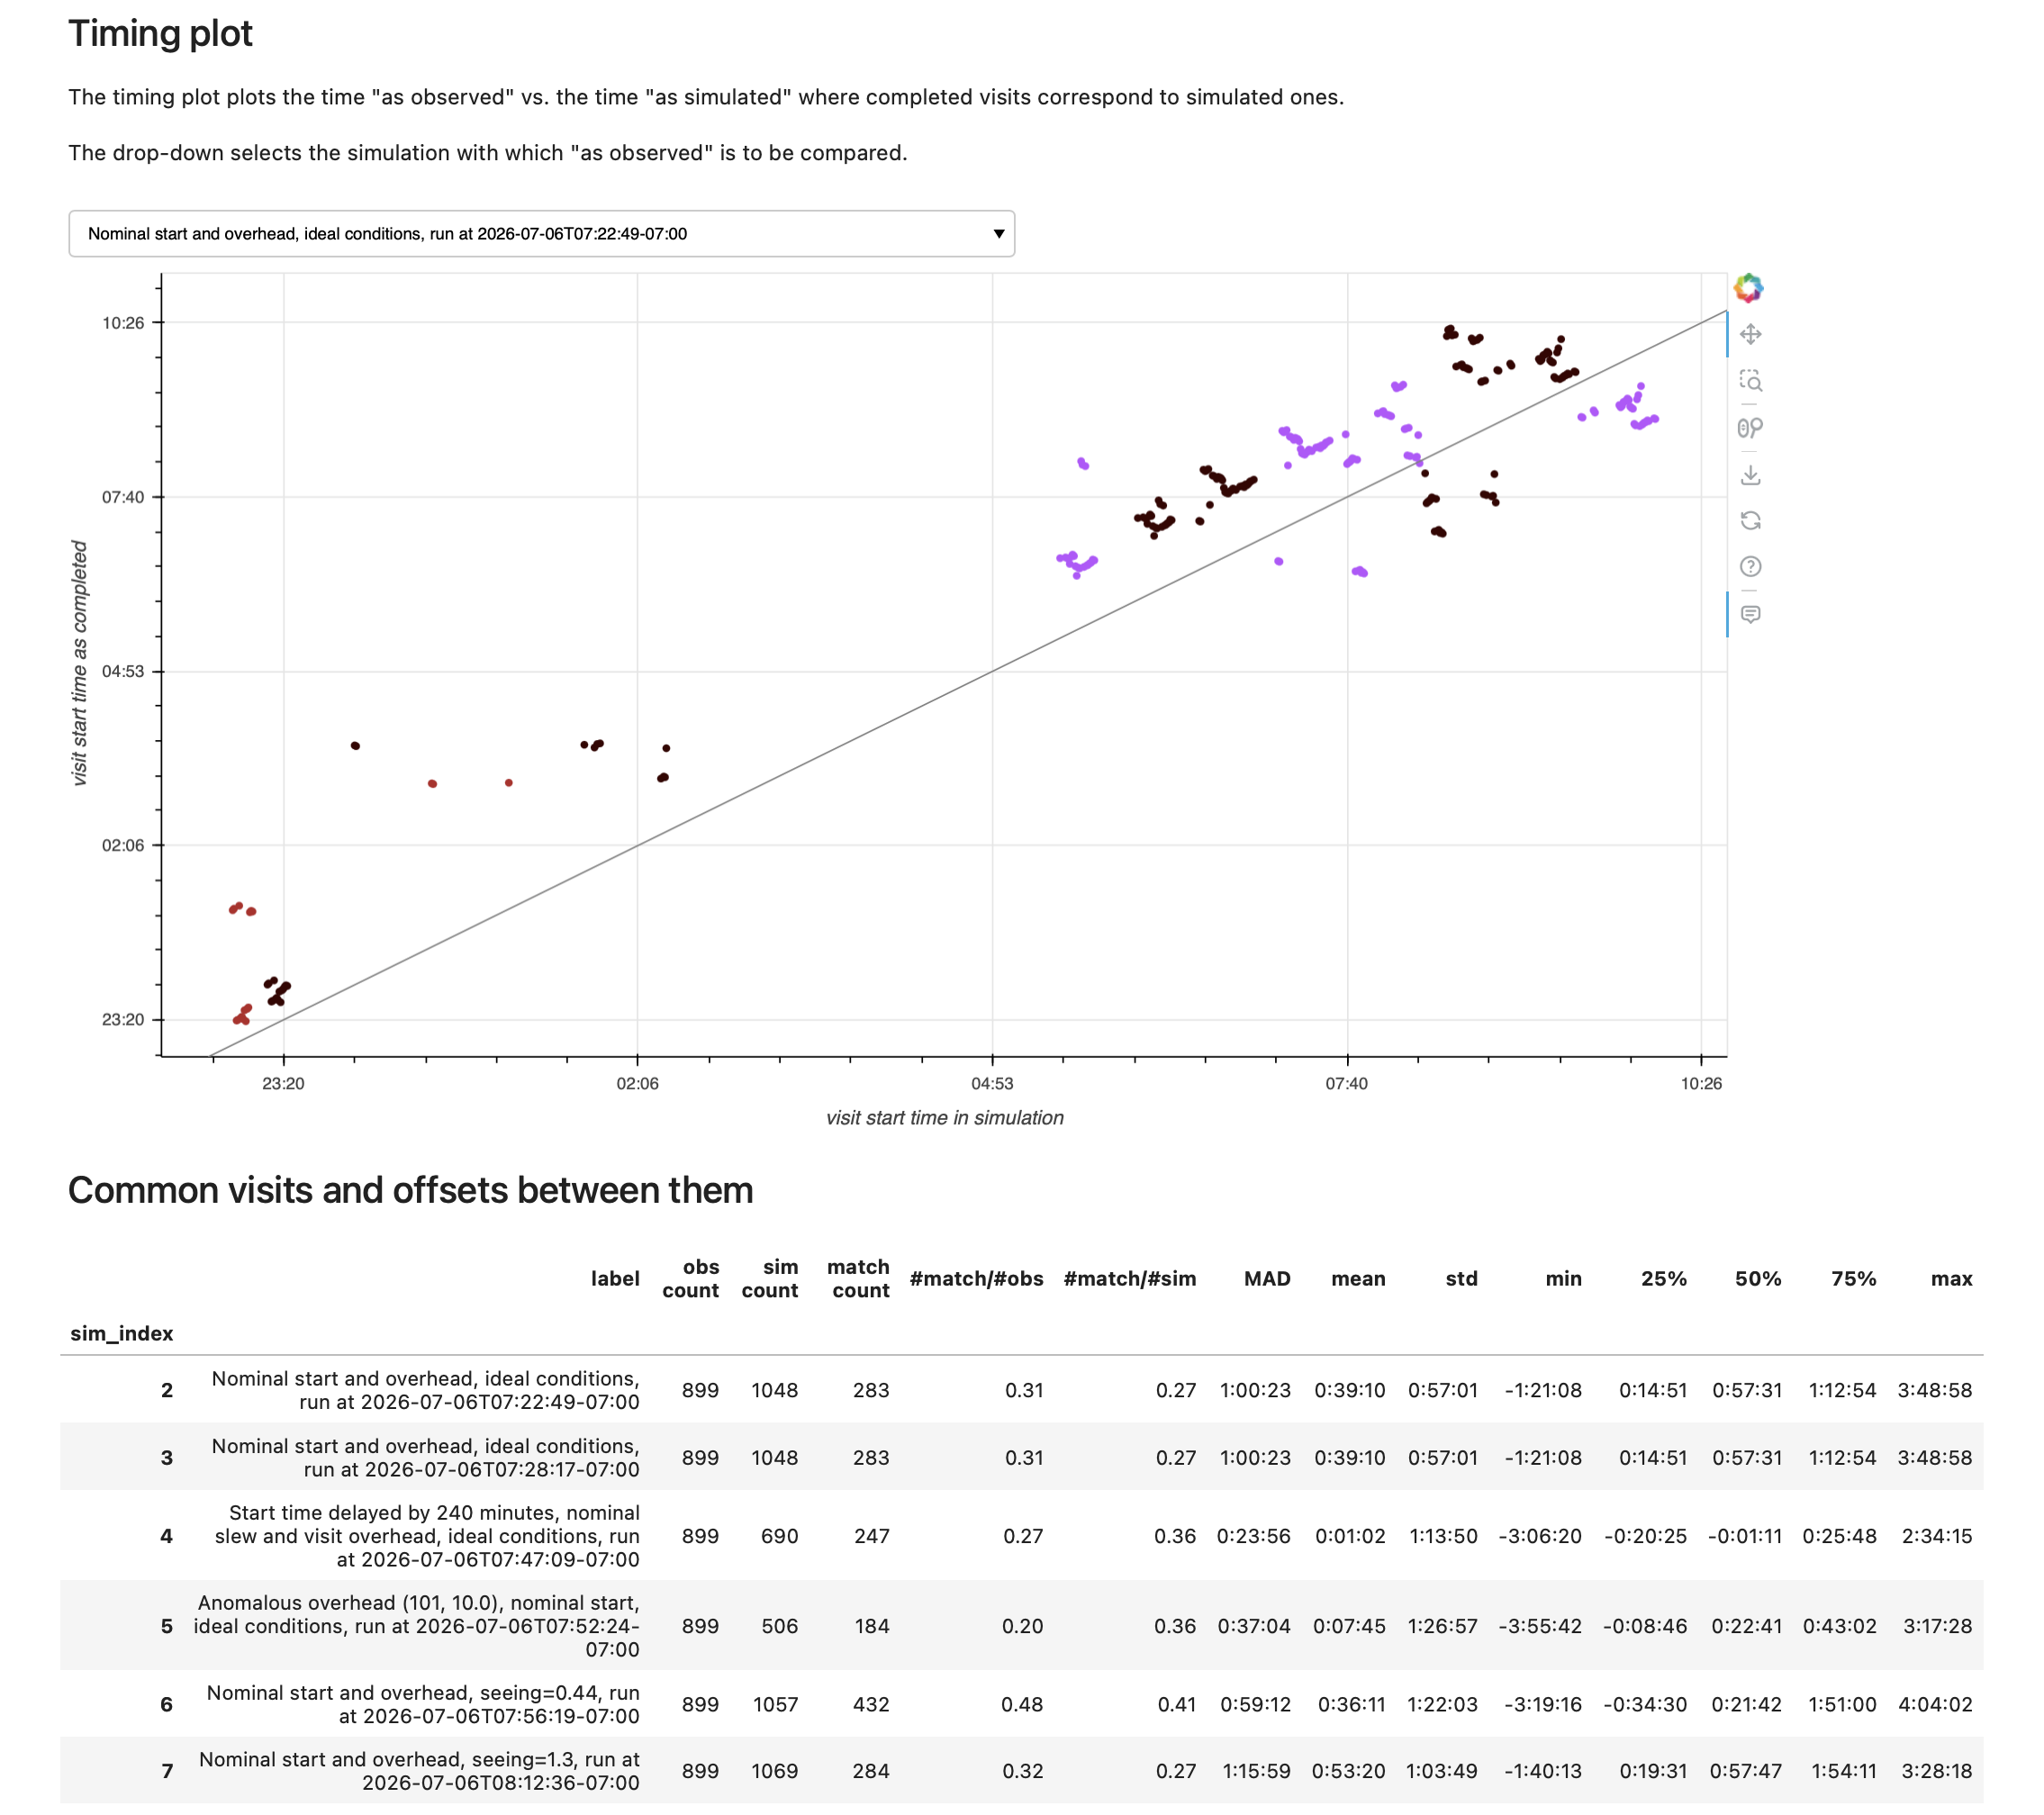
The timing plot section more directly attempts to address the question of - how many of our predicted pointings did we actually observe, and how far apart in time. You can see that on this night, out of 1048 visits in the nominal simulation (which would have gone to the rubin schedule viewer), we actually observed only 283 of the same pointings (out of 899 visits in the night from the observatory), with some scatter around when we observed those same pointings.
You can also see on this particular night, that we have run a simulation where the seeing was fixed at a better than average value, and a larger fraction of visits align in that case. I’d roughly estimate our typical fraction of matched visits at around to 20-30%. We’re working to improve the usefulness of our predictions, including adding information about which pointings are likely to be more reliably obtained (some are sort of ‘fixed points’, which others come from wide area surveys where the pointing is less certain) and what timespan is most likely.