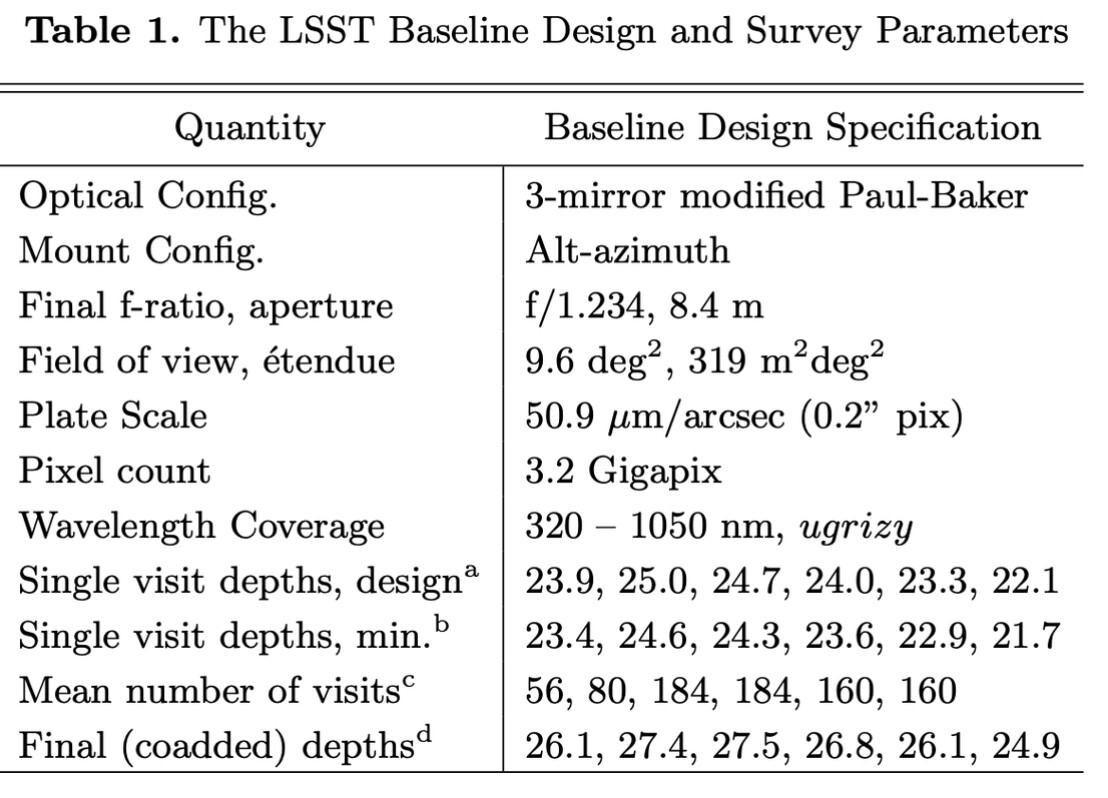
I wanted to make sure that these numbers were up to date & a bit of clarification on them. I am currently working on a project and am planning on specifically using the mean number of visits & single visit depths from this Table 1 from Paper.
The number of visits is per night across the whole sky (for WFD)?
Is each visit in one band or is it alternating in pairs of bands? (from what I understand, a visit is two 15 second exposures)
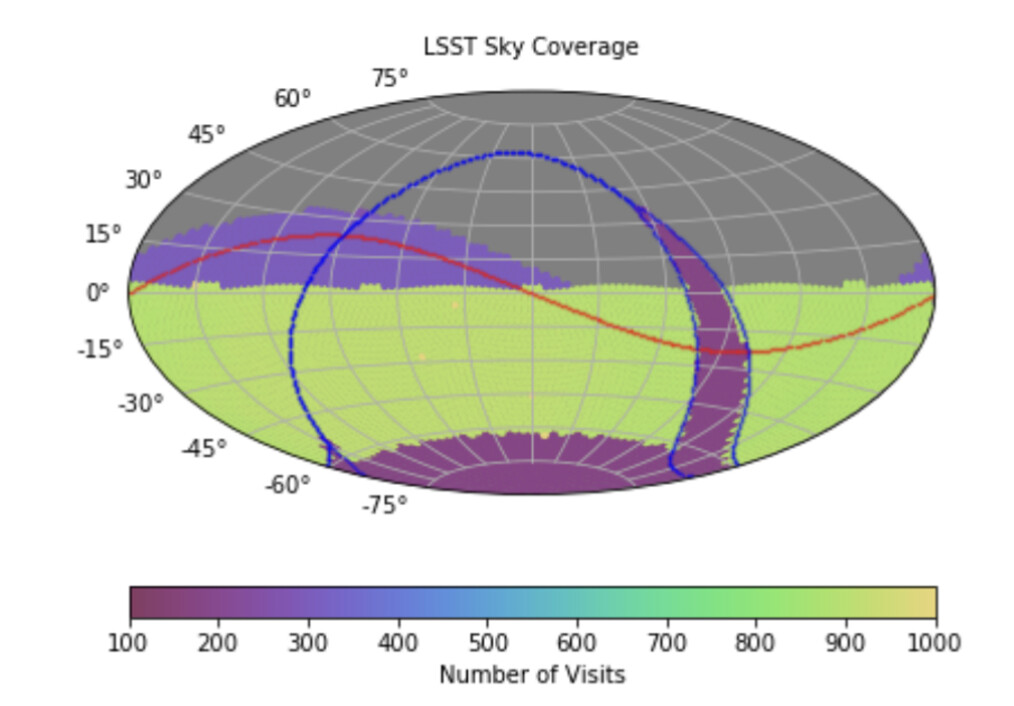
I saw this figure in another paper and was wondering if anyone knew where I could get more precise information or a dataset with the number of visits for specific locations (or at least general areas) perhaps? I have already tried loading in the baseline simulations with OpSim or just accessing the data but was unsuccessful. (for reference, I am an undergrad still learning how to navigate my way through software )
Otherwise, I will approximate with the table and figure, but was hoping to see if anyone knew of alternatives as well as confirm if the numbers are up to date given that there are many updates. Cheers and thank you for any help!
Hi @anacarolina - to answer your two listed questions above: 1) the number of visits listed in the table are the mean number of visits each pointing will get over the 10-year survey, and 2) yes, each visit is in one band - each visit may get two 15-sec exposures, but each visit is in a single band. Also, for a more updated reference paper, Bianco et al. 2022 is a good resource - Table 2 has more recent estimates for the mean number of visits in each band that each pointing will receive over the 10-year survey as well as single visit depths and 10-year coadded depths.
Another helpful resource for interpreting/understanding the baseline simulations with OpSim is the Survey Strategy webpage. Under “Resources”, there is information about the Rubin Scheduler (including tutorials), the simulations, and metric evaluation outputs, which may help you find the number of visits for specific sky locations. @ljones or @yoachim would likely also be able to help you find the information you’re looking for.
Thanks @sgreenstreet - The Bianco paper is a good resource, and yet is also already a bit out of date, as we now have more information on the throughputs! (that said, it’s still pretty close).
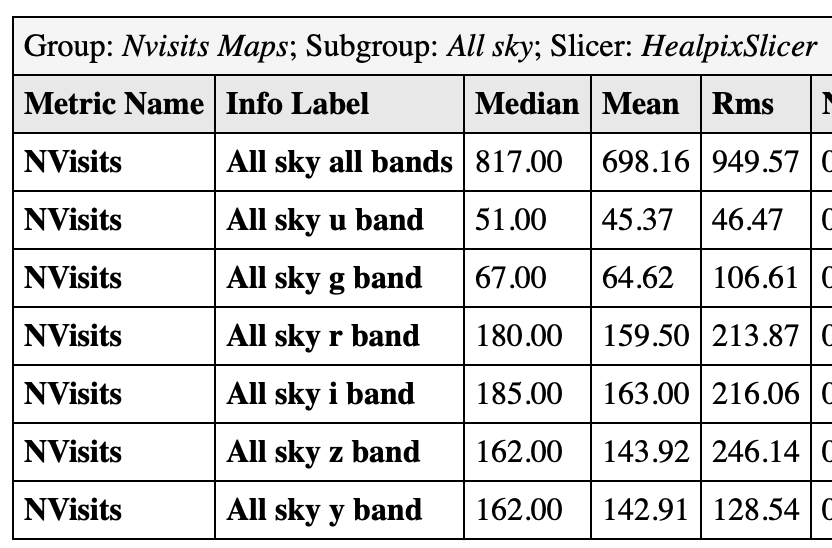
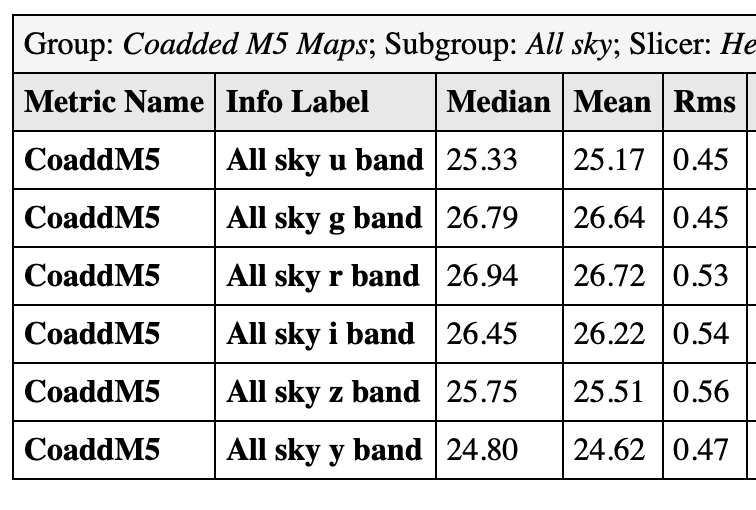
@anacarolina Thank you for helping me realize that another addition to the survey-strategy.lsst.io webpage would be the simple table of typical number of visits per pointing and coadded depths. In the meantime, let me paste these in here for you from our current baseline simulation (baseline_v3.4_10yrs, if you end up coming back and wondering if it’s the same as ‘current’ at a later date).
Hi @anacarolina, just wanted to check that if you had any more follow up questions on the survey parameters given the info from @sgreenstreet and @ljones.