Is there a recommended way to visualize images processed with the Stack (e.g., the masked image of an Exposure) in sky coordinates using the WCS in a notebook? Is this possible with afw.display or another tool?
If you use one of the notebook magic commands that gives you interactive plots, like %matplotlib ipympl, you can hover over the afw.display-ed images and see the sky coordinates. If you want to plot objects at certain coordinates on top of the image, you can use the pixelToSky and/or skyToPixel methods available with the image’s WCS.
Thanks @mrawls. So it seems that one can get the transformation for specific coordinates in the image (either with the hover technique you mentioned, or by overplotting points with known sky coordinates into the pixel coordinates of the image), but maybe it is not possible to directly plot the image in another coordinate system with the current tooling?
@bechtol Do you have an example of what you have in mind?
I was imagining something like this: https://docs.astropy.org/en/stable/visualization/wcsaxes/index.html
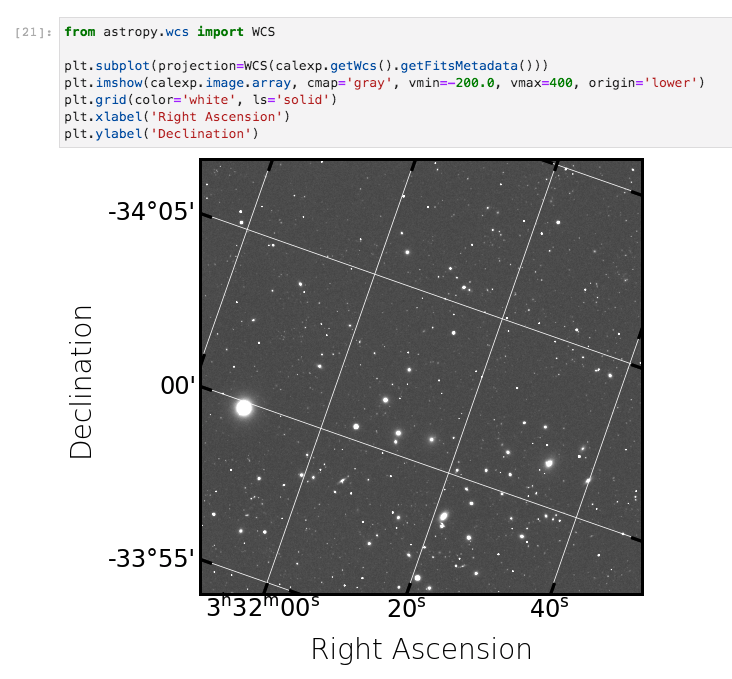
Same image, WCS-based axes.
But are you wanting to warp the image to another projection?
When using Firefly for image visualization, driven by afw.display from a Rubin/LSST stack image, or “natively” against a data service, the WCS is known to the display, and sky coordinates (in equatorial or Galactic systems) for the location of the mouse are displayed continuously, or can be captured for a selected point. In addition, a coordinate grid can be plotted over the image in any of several systems.
I found this topic because I’m also looking to change the afwDisplay axes labels from pixels to sky coordinates. (Attention @jeffcarlin).
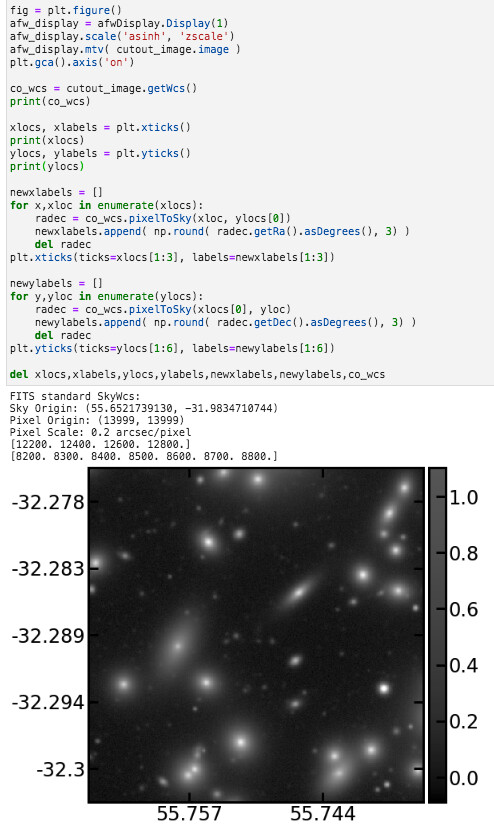
I have made a kludge, screenshot below, but surely there’s a better way? @bechtol did you ever find a way that works?
One better way might be, as @yusra suggested, to put the image’s WCS into an astropy WCS and then use plt.subplot(projection=wcs), but I’m not sure how to do the first part. Trying this:
from astropy.wcs import WCS
co_wcs = WCS(cutout_image.getWcs())
Gives an error that 'lsst.afw.geom._geom.SkyWcs' object has no attribute 'keys', so there’s a formatting mismatch? (I am still looking into how to define an astropy wcs from what getWcs gives me; the contents of co_wcs can be seen in the screenshot below).
Another better way is maybe to just use mtv, if possible? It does seem to take a wcs, but passing something like the following doesn’t change the axes labels:
afw_display.mtv( cutout_image.image, wcs=cutout_image.getWcs() )
This is my kludge. It is ugly.
A Slack message by @suberlak last month showed how to create an astropy WCS from an image’s FITS headers and then plot it using plt.subplot(projection=wcs). In this case, I think you need co_wcs = WCS(cutout_image.getWcs().getFitsMetadata()).
Note that your kludge can be misleading because the RA/dec axes do not align with the image x/y axes that you are labeling.