Regarding calexp plotting: Another issue I’m facing: when I plot some calexps, the coordinate axes seem to be offset from the WCS center. Could I be missing something about the astrometry? The approach I used comes from a DP0 tutorial, which relies on astropy and matplotlib.
Here is the code used for plotting:
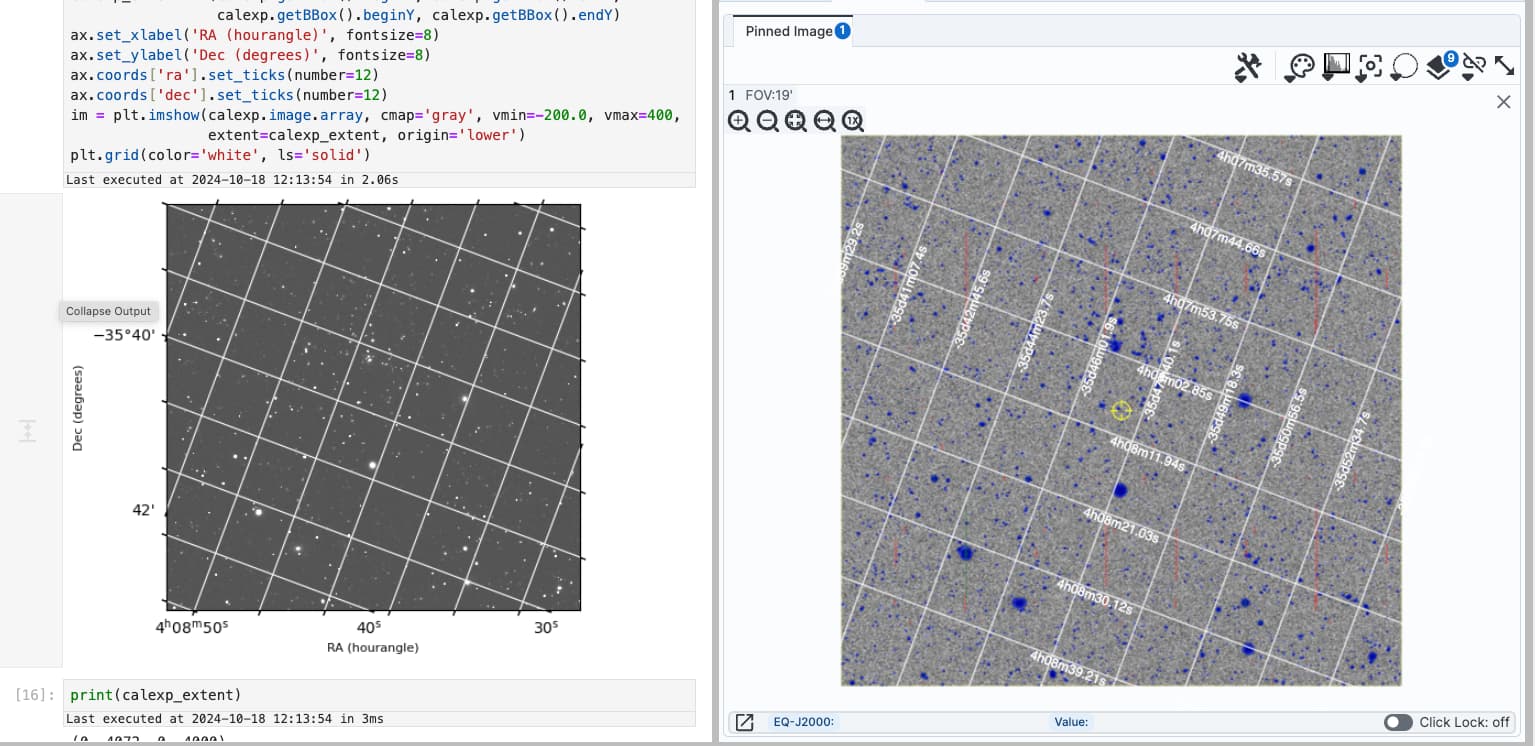
Due to this rotation, when using imshow to visualize visit = 214463 detector = 171 (left panel below), the more horizontal grid lines are RA (labeled where they meet the x-axis) and more vertical grid lines are Dec (labeled where they meet the y-axis).
It is understandable how, at first glance (and with the expectation of “x-axis is RA”), when using imshow it seems the image RA center is closer to 4h 8m 40s or 45s. But with the context of rotation, it becomes clear that in both visualizations the grid lines do indicate an RA center of about 4h 8m 9s.
The rotation is also clearer when using Firefly (right panel below), which is actually how I realized what was going on here.
DP0.2 tutorial notebook 03a will be updated to better demonstrate the pitfalls of imshow with grid overlays, and I will report back here and mark this topic as solved when that is done.
DP0.2 tutorial notebook 03a has been updated to include a new Section 3.2.1 which demonstrates the visualization of rotated calexp’s with matplotlib imshow.
I marked the post above as the solution, but as always, please feel free to reply in thread to confirm whether the solution worked for you!
plazas
(Andres Alejandro Plazas Malagon)
split this topic
#4