Hello everyone,
I am currently working on a project involving the injection and extraction of microlensing light curves in DP0. Specifically, I am focusing on measuring the magnitude at specific RA/Dec points across several calexps to recreate a light curve. My goal is to scale this process for a large number of microlensing events.
I have been experimenting with two methods in the LSST framework to achieve this and would greatly appreciate any insights or recommendations.
-
SingleFrameMeasurementTask: This method provides coherent magnitude and error values consistent with the injected sources. However, it processes all detected sources in the calibrated exposure (calexp), which significantly increases the computation time since I’m only interested in specific points of interest.
Here are the key highlights from my code that provide context:
# Task configuration
config = SourceDetectionTask.ConfigClass()
config.thresholdValue = 5
config.thresholdType = "stdev"
detect_task = SourceDetectionTask(schema=schema, config=config)
schema = afwTable.SourceTable.makeMinimalSchema()
algMetadata = dafBase.PropertyList()
config = SingleFrameMeasurementTask.ConfigClass()
measure_task = SingleFrameMeasurementTask(schema=schema, config=config,  algMetadata=algMetadata)

# Run tasks
detect_result = detect_task.run(tab, injected_exposure)
sources = detect_result.sources
measure_task.run(measCat=sources, exposure=injected_exposure)

# Finding the points of interest
source = sources[(abs((sources["coord_ra"]/np.pi*180) - rai) < delta * k) &
                                     (abs((sources["coord_dec"]/np.pi*180) - deci) < delta * k)]
-
ForcedMeasurementTask: Using this approach, I can measure the flux specifically at my points of interest. However, I am encountering issues with the returned flux values: they are often negative, leading to NaN magnitudes or values greater than expected.
Here are the key highlights from my code that provide context:
schema = afwTable.SourceTable.makeMinimalSchema()
alias = schema.getAliasMap()
x_key = schema.addField("centroid_x", type="D")
y_key = schema.addField("centroid_y", type="D")
alias.set("slot_Centroid", "centroid")

xx_key = schema.addField("shape_xx", type="D")
yy_key = schema.addField("shape_yy", type="D")
xy_key = schema.addField("shape_xy", type="D")
alias.set("slot_Shape", "shape")
type_key = schema.addField("type_flag", type="F")
forcedSource = afwTable.SourceCatalog(schema)
config = ForcedMeasurementTask.ConfigClass()
config.copyColumns = {}
config.plugins.names = ['base_SdssCentroid', "base_TransformedCentroid",
    "base_PsfFlux",
    "base_TransformedShape",
]
config.doReplaceWithNoise = False
forcedMeasurementTask = ForcedMeasurementTask(schema, config=config)

config = CharacterizeImageTask.ConfigClass()
config.psfIterations = 1
charImageTask = CharacterizeImageTask(config=config)

inject_config = VisitInjectConfig()
inject_task = VisitInjectTask(config=inject_config)
My questions:
- Is it possible to measure magnitudes at specific RA/Dec points without processing all detected sources, using SingleFrameMeasurementTask?
- For ForcedMeasurementTask, are there any common pitfalls or parameter settings that might lead to negative flux values? What might be the cause of these NaN or unexpectedly high magnitude readings
Slightly off-topic questions:
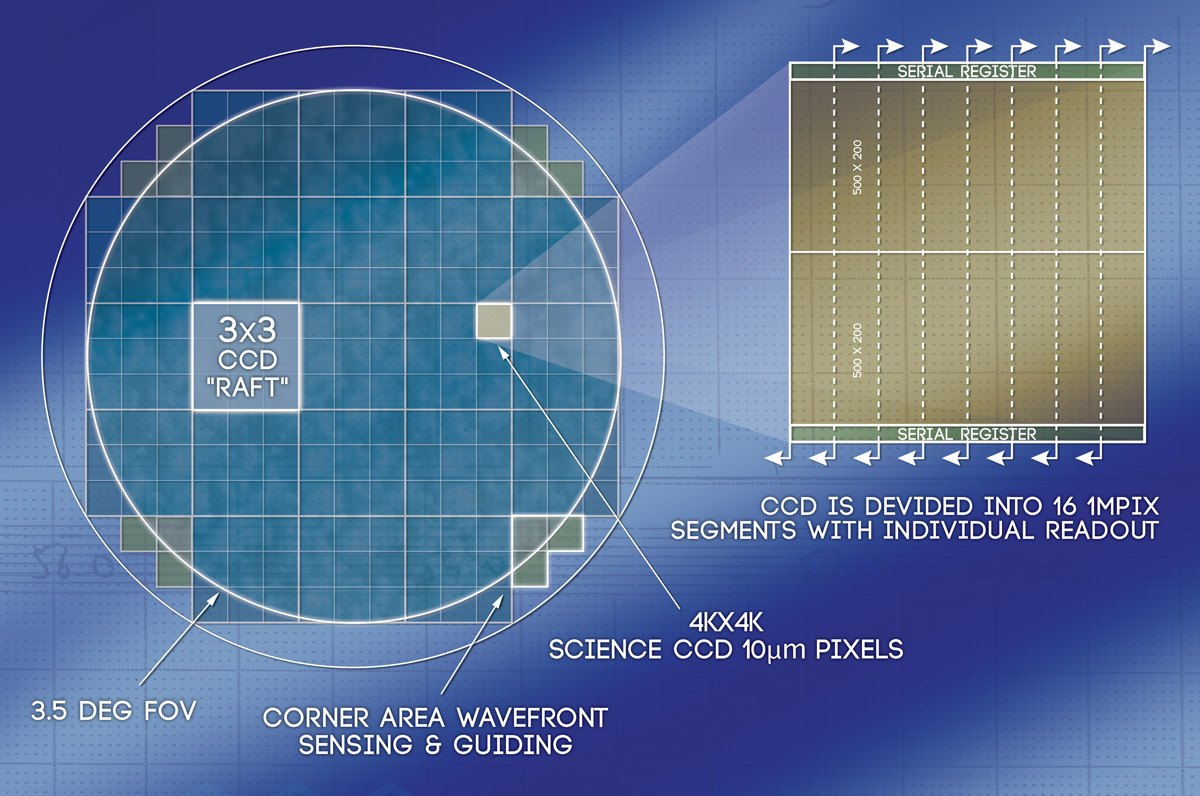
- Is a RAFT equivalent to a detector in the LSST context? Given the calexp sizes, it seems that RAFT might not equal CCD, but I would appreciate clarification on this.
- Regarding the calexp collection using the HTM level: Why is it that some calexps are not captured, even though the HTM level 20 triangles have a boundary circle radius of approximately 0.06 arcsec? Given that a pixel is 0.2 arcsec (which is much larger than 0.06 arcsec), I would expect all points to be covered.
- Regarding calexp plotting: Another issue I’m facing: when I plot some calexps, the coordinate axes seem to be offset from the WCS center. Could I be missing something about the astrometry? The approach I used comes from a DP0 tutorial, which relies on astropy and matplotlib.
Here is the code used for plotting:
# RA (hourangle)
fig = plt.figure()
ax = plt.subplot(projection=WCS(calexp.getWcs().getFitsMetadata()))
calexp_extent = (calexp.getBBox().beginX, calexp.getBBox().endX,
                 calexp.getBBox().beginY, calexp.getBBox().endY)
ax.set_xlabel('RA (hourangle)', fontsize=8)
ax.set_ylabel('Dec (degrees)', fontsize=8)
ax.coords['ra'].set_ticks(number=20)
ax.coords['dec'].set_ticks(number=20)
im = plt.imshow(calexp.image.array, cmap='gray', vmin=-200.0, vmax=400,
                extent=calexp_extent, origin='lower')
plt.grid(color='white', ls='solid')
For example:
- visit = 211488; detector = 103: This calexp plots correctly centered on the WCS.
- visit = 214463; detector = 171: In this case, the WCS center is ~60.04 degrees, but the plot shows ~60.18 degrees (shifted by ~0.14 degrees).
Any guidance or tips would be greatly appreciated. Thank you!