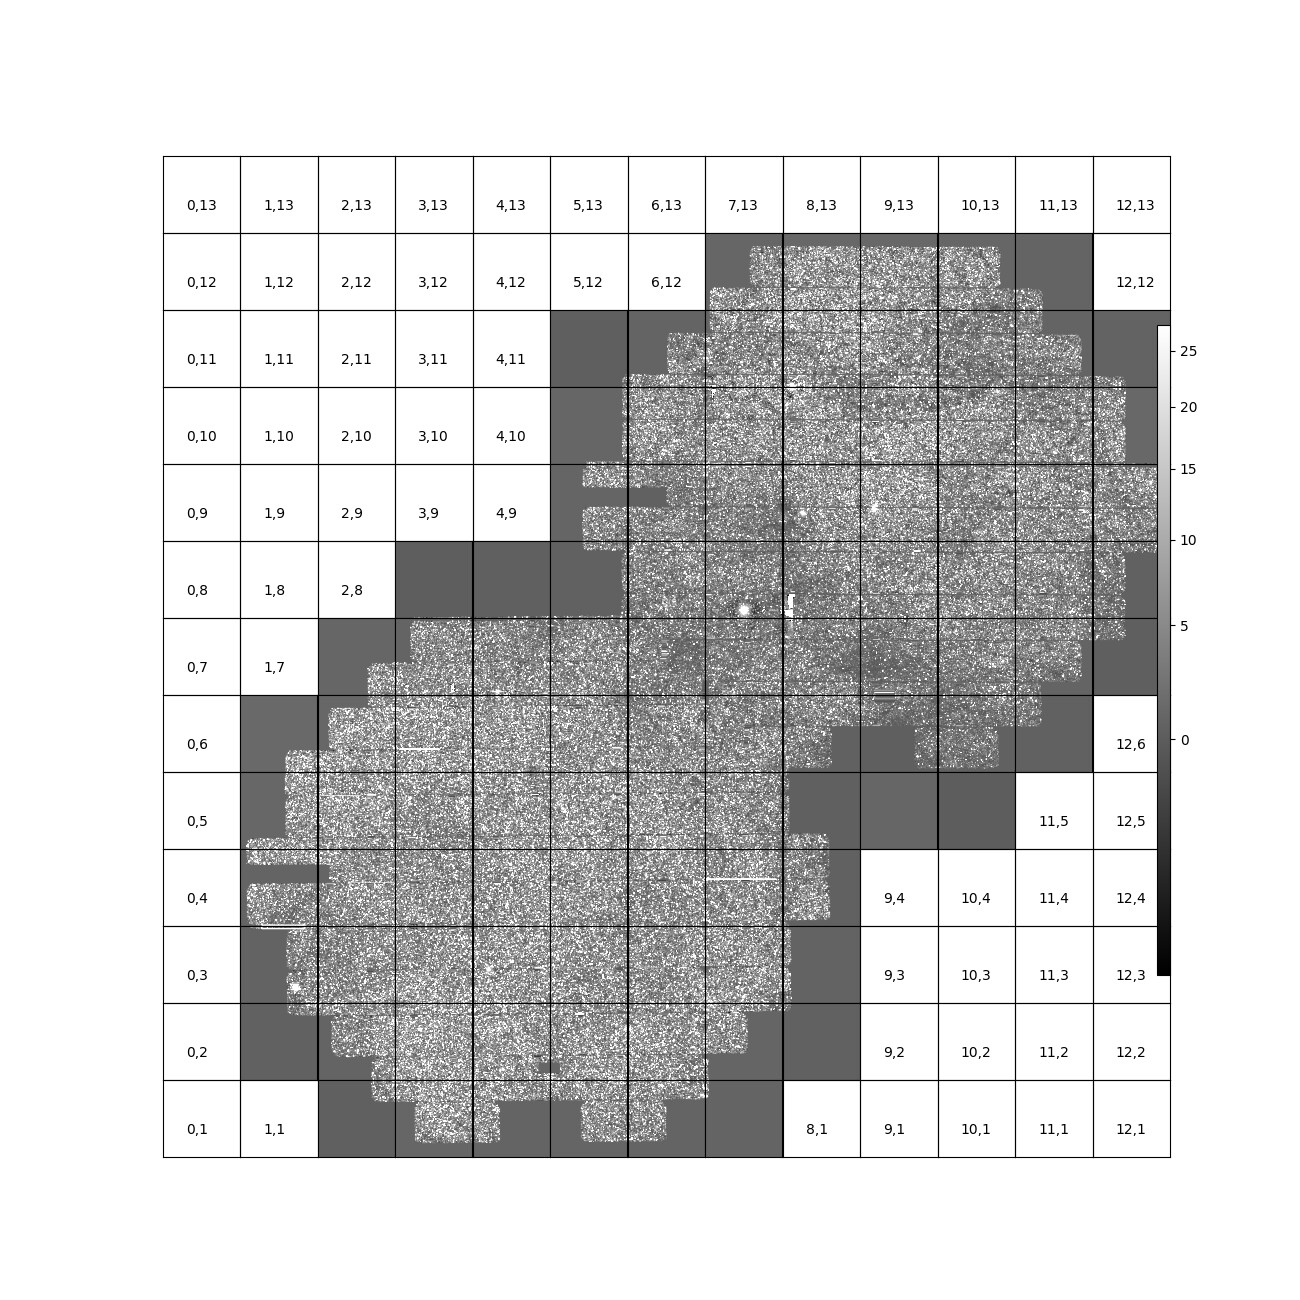
I am wondering if there is a tool similar to VisualizeMosaicExpTask for visualizing one or more tracts of a coadd, meaning multiple patches geometrically aligned in a mosaic. Figures 27-34 of DMTN-171 are exactly the visualizations I am hoping to make, for example: